Estratégia de cobertura de fundo
Visão geral
A estratégia de retorno de ruptura é uma estratégia típica de compra-venda de baixa e alta. Ela usa o indicador RSI para identificar pontos de venda excessiva e, após a queda do preço até um certo ponto, emite um sinal de compra para acumular tokens a preços mais baixos; quando o preço retorna, o lucro é obtido com a definição de RSI para sair da depreciação.
Princípio da estratégia
A estratégia baseia-se principalmente no indicador RSI para identificar pontos de superaquecimento. O indicador RSI tem uma faixa normal entre 0 e 100. O indicador RSI emite um sinal de compra quando cai para um limiar de entrada definido abaixo de 35 e um sinal de venda quando o indicador RSI retorna para um limiar de saída definido acima de 65.
Além disso, a estratégia também introduziu uma média móvel simples de 100 ciclos, que combina com o indicador RSI para criar condições de compra somente quando o preço cai abaixo da média móvel e o RSI entra na zona de oversold. Isso pode filtrar efetivamente algumas brechas falsas e reduzir o número de transações desnecessárias.
Vantagens estratégicas
- Usar o RSI para identificar pontos de sobrevenda e de sobrecompra, para obter melhores custos de compra nos pontos de reversão
- Combinação de média móvel com filtro de falha para evitar o rastreamento
- A tendência é de que os investidores que investem em ações de longo e médio prazo possam explorar a tendência de alta potencial.
Riscos estratégicos e soluções
- Há um certo atraso, uma oportunidade perdida para uma rápida reversão.
- A redução apropriada do ciclo de cálculo do RSI para acelerar a reação do indicador
- A perda de posições pode ser maior em situações de turbulência
- Ajustar o ciclo da média móvel ou cancelar a média móvel
- Relaxamento apropriado dos parâmetros de entrada e saída do RSI
Direção de otimização da estratégia
- Teste de otimização de parâmetros em diferentes moedas e períodos de tempo
- Tente combiná-los com outros indicadores, como o MACD, a faixa de Bryn.
- Ajuste dinâmico do parâmetro do RSI ou do parâmetro da média móvel
- Optimizar estratégias de gestão de posições
Resumir
A estratégia de compensação do fundo é uma estratégia de compra e venda de baixa e alta prática. Através do filtro duplo do RSI e da média móvel, pode-se efetivamente inibir os sinais errôneos, com parâmetros otimizados, pode-se obter um custo de manutenção mais baixo. Ao mesmo tempo, otimizar adequadamente os parâmetros do indicador, ajustar a estratégia de posição, espera-se obter uma maior eficiência no uso de fundos.
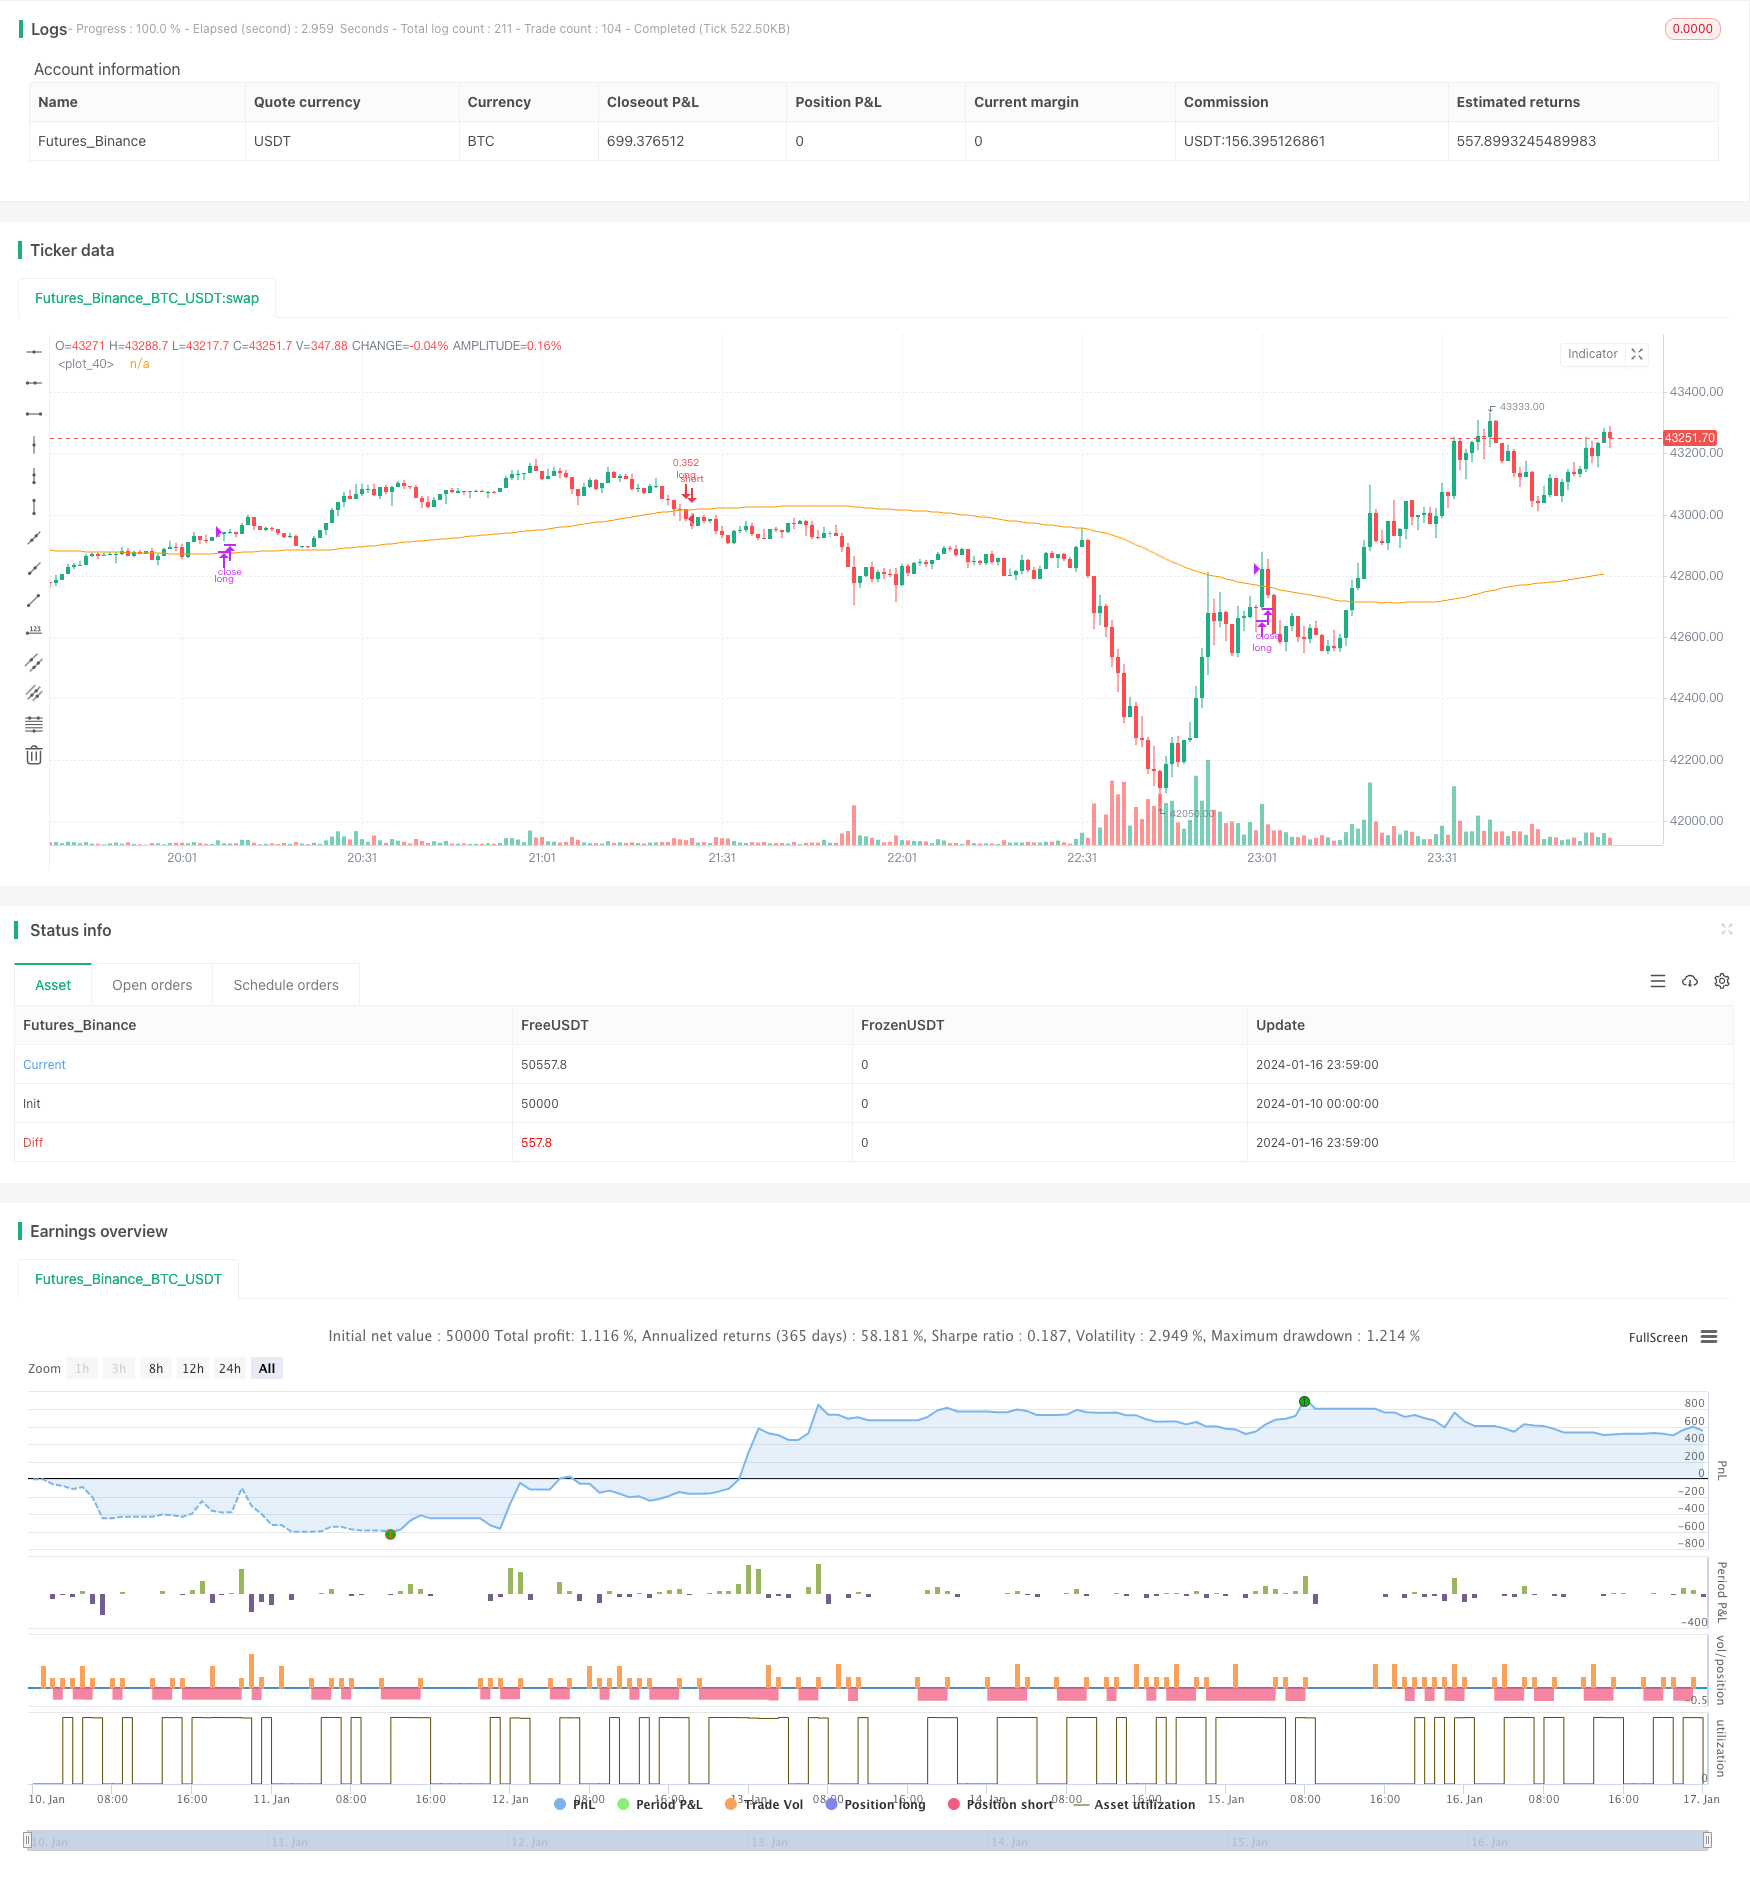
/*backtest
start: 2024-01-10 00:00:00
end: 2024-01-17 00:00:00
period: 1m
basePeriod: 1m
exchanges: [{"eid":"Futures_Binance","currency":"BTC_USDT"}]
*/

// This source code is subject to the terms of the Mozilla Public License 2.0 at https://mozilla.org/MPL/2.0/
// © Coinrule

//@version=4
strategy(shorttitle='Optimized RSI Strategy',title='Optimized RSI Strategy - Buy The Dips (by Coinrule)', overlay=true, initial_capital = 1000, default_qty_type = strategy.percent_of_equity, default_qty_type = strategy.percent_of_equity, default_qty_value = 30, commission_type=strategy.commission.percent, commission_value=0.1)

//Backtest dates
fromMonth = input(defval = 1,    title = "From Month",      type = input.integer, minval = 1, maxval = 12)
fromDay   = input(defval = 1,    title = "From Day",        type = input.integer, minval = 1, maxval = 31)
fromYear  = input(defval = 2020, title = "From Year",       type = input.integer, minval = 1970)
thruMonth = input(defval = 1,    title = "Thru Month",      type = input.integer, minval = 1, maxval = 12)
thruDay   = input(defval = 1,    title = "Thru Day",        type = input.integer, minval = 1, maxval = 31)
thruYear  = input(defval = 2112, title = "Thru Year",       type = input.integer, minval = 1970)

showDate  = input(defval = true, title = "Show Date Range", type = input.bool)

start     = timestamp(fromYear, fromMonth, fromDay, 00, 00)        // backtest start window
finish    = timestamp(thruYear, thruMonth, thruDay, 23, 59)        // backtest finish window
window()  => true       // create function "within window of time"


// RSI inputs and calculations
lengthRSI = (14)
RSI = rsi(close, lengthRSI)

RSI_entry = input(35, title = 'RSI Entry', minval=1)
RSI_exit = input(65, title = 'RSI Close', minval=1)

//Calculate Moving Averages
movingaverage_signal = sma(close, input(100))

//Entry
strategy.entry(id="long", long = true, when = RSI< RSI_entry and close < movingaverage_signal and window())

//Exit
//RSI
strategy.close("long", when = RSI > RSI_exit and window())

plot (movingaverage_signal)