Estratégia de acompanhamento de tendências combinando EMA duplo e RSI
Visão geral
A estratégia usa uma combinação de dupla EMA e RSI para identificar tendências de preços e entrar em ação quando a tendência se reverte. Concretamente, a estratégia usa EMAs de períodos mais longos para determinar a direção da tendência maior e, ao mesmo tempo, usa o indicador RSI para determinar o fenômeno de sobrevenda de sobrevenda de curto prazo. Quando o preço se retira na direção da tendência principal, o indicador RSI emite um sinal de negociação para fazer mais ou fazer menos, de acordo com a direção da tendência.
Princípio da estratégia
Usando a EMA de 200 ciclos para determinar a direção da grande tendência. O preço atravessa a linha EMA superior como sinal de alta e a linha EMA inferior como sinal de baixa.
O indicador RSI tem um parâmetro de 10 períodos. Se o RSI ultrapassar 40 é um sinal de venda e se ele ultrapassar 60 é um sinal de compra.
Quando a grande tendência é ascendente (preço acima da linha EMA), se ocorrer um sinal de oversell de 40 abaixo do RSI, faça mais entrada.
Quando a grande tendência é a baixa (preço abaixo da linha EMA), se ocorrer um sinal de super-compra de 60 no indicador RSI, faça uma entrada de curto prazo.
O Stop Loss é 4 vezes o ATR. O Stop Loss é 2 vezes o Stop Loss, alcançando uma relação de risco-retorno de 2:1.
Análise de vantagens
A maior vantagem da estratégia é a combinação de tendências e indicadores de reversão, permitindo a entrada em tempo hábil em caso de retração de tendências, o que permite um melhor desempenho. As vantagens específicas são as seguintes:
Usando o sistema de dupla EMA para determinar a direção das principais tendências, pode-se acompanhar eficazmente a tendência dos preços.
O indicador RSI permite identificar os casos de sobrecompra e sobrevenda em curto prazo, ajudando a determinar o momento de entrar no mercado.
O Stop Loss é definido através do indicador ATR, que pode ser ajustado de acordo com a volatilidade do mercado, o que favorece o controle de risco.
Seguir rigorosamente os princípios da negociação de tendências pode reduzir transações desnecessárias e reduzir o risco sistemático.
Análise de Riscos
A estratégia tem os seguintes riscos:
No processo de diminuição da oscilação da tendência, pode haver sinais de negociação errados.
Em situações extremas, o stop loss definido pelo indicador ATR pode ser muito grande ou muito pequeno e precisa de um ajuste dinâmico. Também pode ser considerado a substituição por outros métodos de stop loss.
Os sinais de negociação podem ser produzidos com uma frequência mais alta, e é necessário se preocupar se eles estão de acordo com suas preferências de frequência de negociação.
É necessário prestar atenção se os parâmetros do RSI estão definidos adequadamente e se os parâmetros são otimizados quando apropriado.
Direção de otimização
A estratégia pode ser melhorada nos seguintes aspectos:
Pode-se testar a adição de outros indicadores de tendência, como o MACD, para auxiliar na direção da tendência.
Pode-se testar outros indicadores de reversão, como o KDJ, as bandas Brin e outros, em combinação com o RSI, em busca de melhores sinais de negociação.
Algoritmos de aprendizagem de máquina podem ser introduzidos para realizar o stop loss e o stop stop dinâmico, ajustando os parâmetros de forma adaptativa.
O sistema pode ser avaliado com base em mais fatores, como o nível de emoção, o nível de notícias, etc., o que aumenta a robustez geral do sistema.
Resumir
Em geral, esta estratégia é uma estratégia de linha curta muito típica, que combina o acompanhamento de tendências e a inversão de indicadores. Usando o duplo EMA para determinar a tendência maior, ao mesmo tempo em que usa a característica de reversão do indicador RSI para capturar a oportunidade de pullback na tendência.
/*backtest
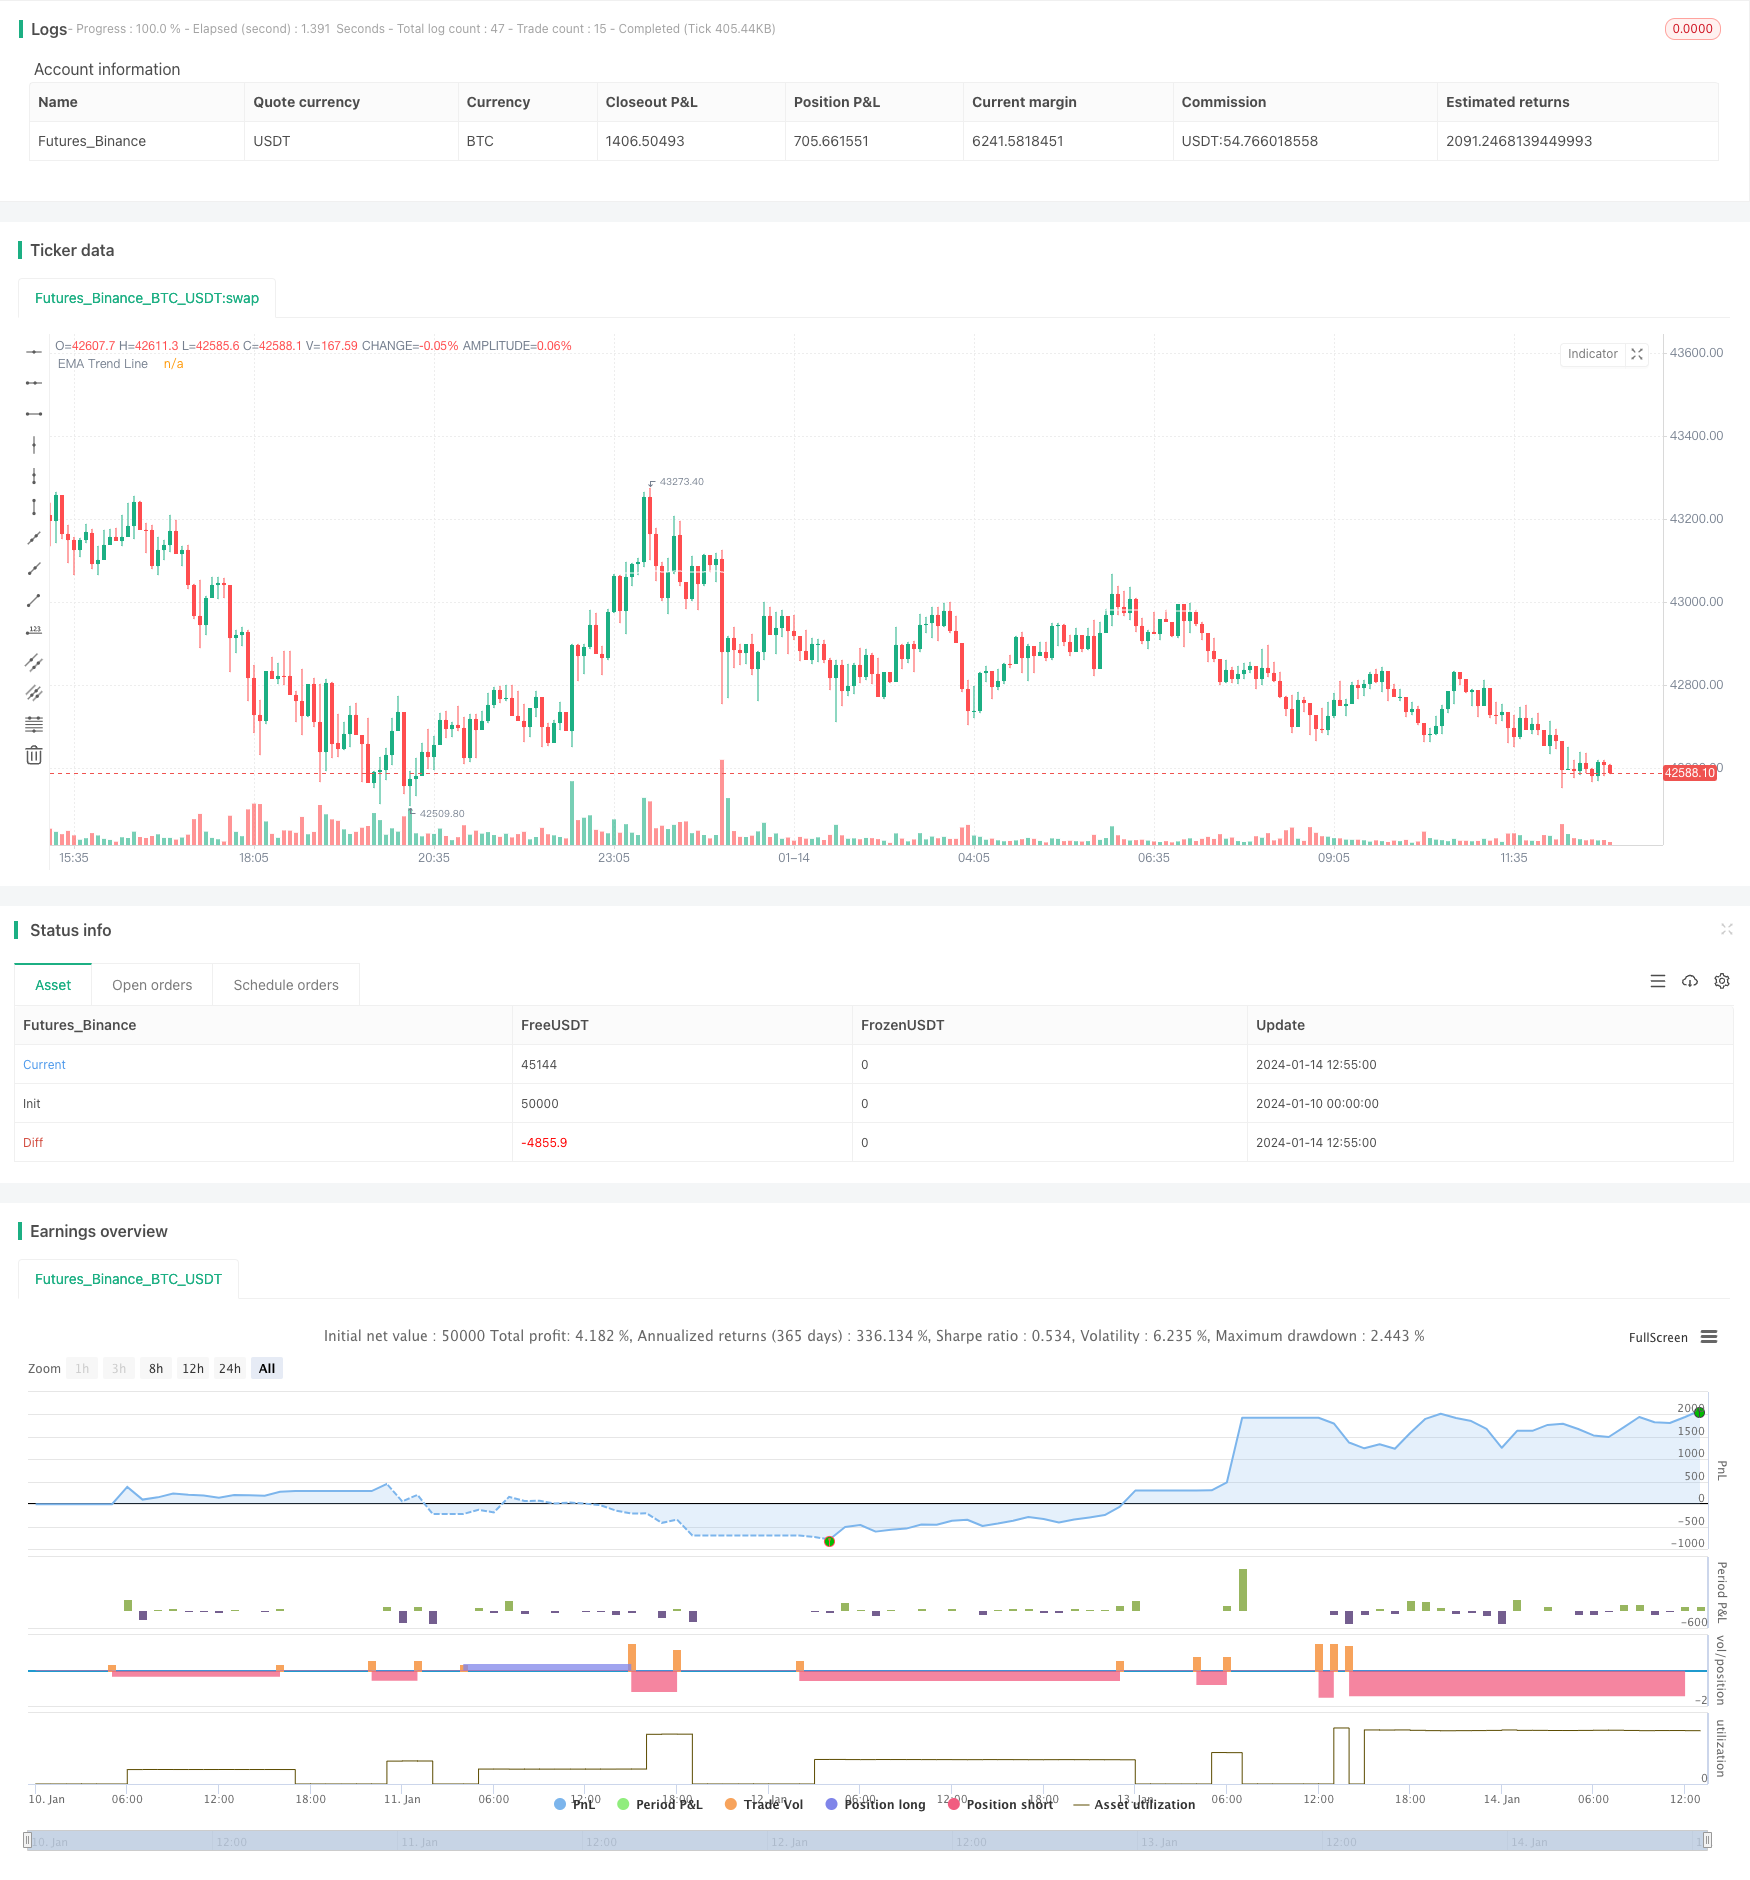
start: 2024-01-10 00:00:00
end: 2024-01-14 13:00:00
period: 5m
basePeriod: 1m
exchanges: [{"eid":"Futures_Binance","currency":"BTC_USDT"}]
*/
// This source code is subject to the terms of the Mozilla Public License 2.0 at https://mozilla.org/MPL/2.0/
// © kevinmck100
// @description
// This strategy is intended to be used as a base template for building new strategies.
//
// It incorporates the following features:
//
// - Risk management: Configurable X% loss per stop loss
// Configurable R:R ratio
//
// - Trade entry: Calculated position size based on risk tolerance
//
// - Trade exit: Stop Loss currently configurable ATR multiplier but can be replaced based on strategy
// Take Profit calculated from Stop Loss using R:R ratio
//
// - Backtesting: Configurable backtesting range by date
//
// - Trade drawings: TP/SL boxes drawn for all trades. Can be turned on and off
// Trade exit information labels. Can be turned on and off
// NOTE: Trade drawings will only be applicable when using overlay strategies
//
// - Debugging: Includes section with useful debugging techniques
//
// Strategy conditions:
//
// - Trade entry: LONG: C1: Price is above EMA line
// C2: RSI is crossing out of oversold area
// SHORT: C1: Price is below EMA line
// C2: RSI is crossing out of overbought area
//
// - Trade exit: Stop Loss: Stop Loss ATR multiplier is hit
// Take Profit: R:R multiplier * Stop Loss is hit
//
// The idea is to use RSI to catch pullbacks within the main trend. Note that
// this strategy is intended to be a simple base strategy for building upon.
// It was not designed to be traded in its current form.
//@version=5
INITIAL_CAPITAL = 1000
DEFAULT_COMMISSION = 0.02
MAX_DRAWINGS = 500
IS_OVERLAY = true
strategy("Risk Management Strategy Template", "Strategy Template", overlay = IS_OVERLAY, initial_capital = INITIAL_CAPITAL, currency = currency.NONE, max_labels_count = MAX_DRAWINGS, max_boxes_count = MAX_DRAWINGS, max_lines_count = MAX_DRAWINGS, default_qty_type = strategy.cash, commission_type = strategy.commission.percent, commission_value = DEFAULT_COMMISSION)
// =============================================================================
// INPUTS
// =============================================================================
// ------------------------ Replacable section - Start -------------------------
// ------------------
// Indicator Settings
// ------------------
emaLength = input.int (200, "EMA Length ", group = "Indicators: Settings", inline = "IS1", minval = 1, tooltip = "EMA line to identify trend direction. Above EMA trend line is bullish. Below EMA trend line is bearish")
rsiLength = input.int (10, "RSI Length ", group = "Indicators: Settings", inline = "IS2", minval = 1)
// ----------------------
// Trade Entry Conditions
// ----------------------
rsiOverbought = input.int (60, "RSI Overbought ", group = "Strategy: Conditions", inline = "SC1", minval = 50, maxval = 100, tooltip = "RSI overbought level used to identify pullbacks within the main trend. RSI crossing BELOW this level triggers a SHORT when in a DOWN trend")
rsiOversold = input.int (40, "RSI Oversold ", group = "Strategy: Conditions", inline = "SC2", minval = 0, maxval = 50, tooltip = "RSI overbought level used to identify pullbacks within the main trend. RSI crossing ABOVE this level triggers a LONG when in an UP trend")
// ---------------------
// Trade Exit Conditions
// ---------------------
atrLength = input.int (14, "Stop Loss ATR Length ", group = "Strategy: Exit Conditions", inline = "EC1", minval = 0, tooltip = "Length of ATR used to calculate Stop Loss.")
slAtrMultiplier = input.float(4, "Stop Loss ATR Multiplier ", group = "Strategy: Exit Conditions", inline = "EC2", minval = 0, step = 0.1, tooltip = "Size of StopLoss is determined by multiplication of ATR value. Take Profit is derived from this also by multiplying the StopLoss value by the Risk:Reward multiplier.")
// ------------------------- Replacable section - End --------------------------
// ---------------
// Risk Management
// ---------------
riskReward = input.float(2, "Risk : Reward 1 :", group = "Strategy: Risk Management", inline = "RM1", minval = 0, step = 0.1, tooltip = "Previous high or low (long/short dependant) is used to determine TP level. 'Risk : Reward' ratio is then used to calculate SL based of previous high/low level.\n\nIn short, the higher the R:R ratio, the smaller the SL since TP target is fixed by previous high/low price data.")
accountRiskPercent = input.float(1, "Portfolio Risk % ", group = "Strategy: Risk Management", inline = "RM1", minval = 0, step = 0.1, tooltip = "Percentage of portfolio you lose if trade hits SL.\n\nYou then stand to gain\n Portfolio Risk % * Risk : Reward\nif trade hits TP.")
// ----------
// Date Range
// ----------
startYear = input.int (2022, "Start Date ", group = 'Strategy: Date Range', inline = 'DR1', minval = 1900, maxval = 2100)
startMonth = input.int (1, "", group = 'Strategy: Date Range', inline = 'DR1', options = [1, 2, 3, 4, 5, 6, 7, 8, 9, 10, 11, 12])
startDate = input.int (1, "", group = 'Strategy: Date Range', inline = 'DR1', options = [1, 2, 3, 4, 5, 6, 7, 8, 9, 10, 11, 12, 13, 14, 15, 16, 17, 18, 19, 20, 21, 22, 23, 24, 25, 26, 27, 28, 29, 30, 31])
endYear = input.int (2100, "End Date ", group = 'Strategy: Date Range', inline = 'DR2', minval = 1900, maxval = 2100)
endMonth = input.int (1, "", group = 'Strategy: Date Range', inline = 'DR2', options = [1, 2, 3, 4, 5, 6, 7, 8, 9, 10, 11, 12])
endDate = input.int (1, "", group = 'Strategy: Date Range', inline = 'DR2', options = [1, 2, 3, 4, 5, 6, 7, 8, 9, 10, 11, 12, 13, 14, 15, 16, 17, 18, 19, 20, 21, 22, 23, 24, 25, 26, 27, 28, 29, 30, 31])
// ----------------
// Drawing Settings
// ----------------
showTpSlBoxes = input.bool(false, "Show TP / SL Boxes", group = "Strategy: Drawings", inline = "D1", tooltip = "Show or hide TP and SL position boxes.\n\nNote: TradingView limits the maximum number of boxes that can be displayed to 500 so they may not appear for all price data under test.")
showLabels = input.bool(false, "Show Trade Exit Labels", group = "Strategy: Drawings", inline = "D2", tooltip = "Useful labels to identify Profit/Loss and cumulative portfolio capital after each trade closes.\n\nAlso note that TradingView limits the max number of 'boxes' that can be displayed on a chart (max 500). This means when you lookback far enough on the chart you will not see the TP/SL boxes. However you can check this option to identify where trades exited.")
// =============================================================================
// INDICATORS
// =============================================================================
// ------------------------ Replacable section - Start -------------------------
// ---
// EMA
// ---
ema = ta.ema(close, emaLength)
plot(ema, "EMA Trend Line", color.white)
// ---
// RSI
// ---
rsi = ta.rsi(close, rsiLength)
// ------------------------- Replacable section - End --------------------------
// =============================================================================
// STRATEGY LOGIC
// =============================================================================
// ---------
// FUNCTIONS
// ---------
percentAsPoints(pcnt) =>
math.round(pcnt / 100 * close / syminfo.mintick)
calcStopLossPrice(pointsOffset, isLong) =>
priceOffset = pointsOffset * syminfo.mintick
if isLong
close - priceOffset
else
close + priceOffset
calcProfitTrgtPrice(pointsOffset, isLong) =>
calcStopLossPrice(-pointsOffset, isLong)
printLabel(barIndex, msg) => label.new(barIndex, close, msg)
printTpSlHitBox(left, right, slHit, tpHit, entryPrice, slPrice, tpPrice) =>
if showTpSlBoxes
box.new (left = left, top = entryPrice, right = right, bottom = slPrice, bgcolor = slHit ? color.new(color.red, 60) : color.new(color.gray, 90), border_width = 0)
box.new (left = left, top = entryPrice, right = right, bottom = tpPrice, bgcolor = tpHit ? color.new(color.green, 60) : color.new(color.gray, 90), border_width = 0)
line.new(x1 = left, y1 = entryPrice, x2 = right, y2 = entryPrice, color = color.new(color.yellow, 20))
line.new(x1 = left, y1 = slPrice, x2 = right, y2 = slPrice, color = color.new(color.red, 20))
line.new(x1 = left, y1 = tpPrice, x2 = right, y2 = tpPrice, color = color.new(color.green, 20))
printTpSlNotHitBox(left, right, entryPrice, slPrice, tpPrice) =>
if showTpSlBoxes
box.new (left = left, top = entryPrice, right = right, bottom = slPrice, bgcolor = color.new(color.gray, 90), border_width = 0)
box.new (left = left, top = entryPrice, right = right, bottom = tpPrice, bgcolor = color.new(color.gray, 90), border_width = 0)
line.new(x1 = left, y1 = entryPrice, x2 = right, y2 = entryPrice, color = color.new(color.yellow, 20))
line.new(x1 = left, y1 = slPrice, x2 = right, y2 = slPrice, color = color.new(color.red, 20))
line.new(x1 = left, y1 = tpPrice, x2 = right, y2 = tpPrice, color = color.new(color.green, 20))
printTradeExitLabel(x, y, posSize, entryPrice, pnl) =>
if showLabels
labelStr = "Position Size: " + str.tostring(math.abs(posSize), "#.##") + "\nPNL: " + str.tostring(pnl, "#.##") + "\nCapital: " + str.tostring(strategy.equity, "#.##") + "\nEntry Price: " + str.tostring(entryPrice, "#.##")
label.new(x = x, y = y, text = labelStr, color = pnl > 0 ? color.new(color.green, 60) : color.new(color.red, 60), textcolor = color.white, style = label.style_label_down)
// ----------
// CONDITIONS
// ----------
inDateRange = time >= timestamp(syminfo.timezone, startYear, startMonth, startDate, 0, 0) and time < timestamp(syminfo.timezone, endYear, endMonth, endDate, 0, 0)
// ------------------------ Replacable section - Start -------------------------
// Condition 1: Price above EMA indicates bullish trend, price below EMA indicates bearish trend
bullEma = close > ema
bearEma = close < ema
// Condition 2: RSI crossing back from overbought/oversold indicates pullback within trend
bullRsi = ta.crossover (rsi, rsiOversold)
bearRsi = ta.crossunder (rsi, rsiOverbought)
// Combine all entry conditions
goLong = inDateRange and bullEma and bullRsi
goShort = inDateRange and bearEma and bearRsi
// ------------------------- Replacable section - End --------------------------
// Trade entry and exit variables
var tradeEntryBar = bar_index
var profitPoints = 0.
var lossPoints = 0.
var slPrice = 0.
var tpPrice = 0.
var inLong = false
var inShort = false
// Entry decisions
openLong = (goLong and not inLong)
openShort = (goShort and not inShort)
flippingSides = (goLong and inShort) or (goShort and inLong)
enteringTrade = openLong or openShort
inTrade = inLong or inShort
// ------------------------ Replacable section - Start -------------------------
// Exit calculations
atr = ta.atr(atrLength)
slAmount = atr * slAtrMultiplier
slPercent = math.abs((1 - (close - slAmount) / close) * 100)
tpPercent = slPercent * riskReward
// ------------------------- Replacable section - End --------------------------
// Risk calculations
riskAmt = strategy.equity * accountRiskPercent / 100
entryQty = math.abs(riskAmt / slPercent * 100) / close
if openLong
if strategy.position_size < 0
printTpSlNotHitBox(tradeEntryBar + 1, bar_index + 1, strategy.position_avg_price, slPrice, tpPrice)
printTradeExitLabel(bar_index + 1, math.max(tpPrice, slPrice), strategy.position_size, strategy.position_avg_price, strategy.openprofit)
strategy.entry("Long", strategy.long, qty = entryQty, alert_message = "Long Entry")
enteringTrade := true
inLong := true
inShort := false
if openShort
if strategy.position_size > 0
printTpSlNotHitBox(tradeEntryBar + 1, bar_index + 1, strategy.position_avg_price, slPrice, tpPrice)
printTradeExitLabel(bar_index + 1, math.max(tpPrice, slPrice), strategy.position_size, strategy.position_avg_price, strategy.openprofit)
strategy.entry("Short", strategy.short, qty = entryQty, alert_message = "Short Entry")
enteringTrade := true
inShort := true
inLong := false
if enteringTrade
profitPoints := percentAsPoints(tpPercent)
lossPoints := percentAsPoints(slPercent)
slPrice := calcStopLossPrice(lossPoints, openLong)
tpPrice := calcProfitTrgtPrice(profitPoints, openLong)
tradeEntryBar := bar_index
strategy.exit("TP/SL", profit = profitPoints, loss = lossPoints, comment_profit = "TP Hit", comment_loss = "SL Hit", alert_profit = "TP Hit Alert", alert_loss = "SL Hit Alert")
// =============================================================================
// DRAWINGS
// =============================================================================
// -----------
// TP/SL Boxes
// -----------
slHit = (inShort and high >= slPrice) or (inLong and low <= slPrice)
tpHit = (inLong and high >= tpPrice) or (inShort and low <= tpPrice)
exitTriggered = slHit or tpHit
entryPrice = strategy.closedtrades.entry_price (strategy.closedtrades - 1)
pnl = strategy.closedtrades.profit (strategy.closedtrades - 1)
posSize = strategy.closedtrades.size (strategy.closedtrades - 1)
// Print boxes for trades closed at profit or loss
if (inTrade and exitTriggered)
inShort := false
inLong := false
printTpSlHitBox(tradeEntryBar + 1, bar_index, slHit, tpHit, entryPrice, slPrice, tpPrice)
printTradeExitLabel(bar_index, math.max(tpPrice, slPrice), posSize, entryPrice, pnl)
// Print TP/SL box for current open trade
if barstate.islastconfirmedhistory and strategy.position_size != 0
printTpSlNotHitBox(tradeEntryBar + 1, bar_index + 1, strategy.position_avg_price, slPrice, tpPrice)
// =============================================================================
// DEBUGGING
// =============================================================================
// Data window plots
plotchar(slPrice, "Stop Loss Price", "")
plotchar(tpPrice, "Take Profit Price", "")
// Label plots
plotDebugLabels = false
if plotDebugLabels
if bar_index == tradeEntryBar
printLabel(bar_index, "Position size: " + str.tostring(entryQty * close, "#.##"))