Estratégia de negociação de acompanhamento de tendências com base em MACD e RSI
Visão geral
Esta estratégia permite o acompanhamento da tendência através da computação dos indicadores MACD e RSI, combinando tendências e filtros de sobrevenda e sobrevenda. Esta estratégia é adequada para negociações de linha média e longa, e pode efetivamente filtrar breakouts falsos, confirmar a direção da tendência, estabelecer posições no início do desenvolvimento da tendência e, posteriormente, usar métodos de bloqueio de lucro, como o rastreamento de stop-loss.
Princípios
A estratégia é baseada principalmente em MACD e RSI para a geração de sinais de negociação.
O MACD é um indicador de diferença de média móvel, composto por diferença de desvio ((DIF), linha de sinal ((DEA) e distanciamento da coluna. Nesta estratégia, o DIFF é o diferencial entre a média móvel de 5 dias e a média móvel de 13 dias, e a DEA é a média móvel de 5 dias do DIFF.
O RSI é um indicador de força e fraqueza relativa que compara o número de dias de alta e de queda de fechamento médio durante um período de tempo para determinar se o mercado está sobrecomprado ou sobrevendido. Nesta estratégia, o ciclo do RSI é definido como 14. O RSI maior que 70 é a zona de sobrecompra e menor que 30 é a zona de venda.
Combinando o sinal de negociação do MACD com o sinal de filtragem do RSI, faça o over quando o MACD gera um sinal de compra e o RSI não entra na zona de superabando; faça o short quando o MACD gera um sinal de venda e o RSI não entra na zona de superabando.
Além disso, esta estratégia também julga se a linha K atual é diferente da cor da linha K anterior, e se for a mesma, salta o sinal de transação. Esta estratégia foi projetada principalmente para filtrar falsas brechas.
Após a entrada em bolsa, a estratégia julga se o preço de fechamento da próxima linha K é maior ou menor do que o preço de abertura, e se as condições forem atendidas, a tendência é comprovada, e a posição é parada.
Vantagens
- Utilizando sinais de negociação MACD e filtragem RSI, é possível localizar a direção da tendência e evitar perdas desnecessárias com falsas rupturas
- O Stop Loss Tracking foi projetado para bloquear os lucros e evitar que os retornos tragam perdas para as contas.
- A combinação de indicadores de tendência e indicadores de sobrevenda e sobrevenda permite o acompanhamento de tendências e o refúgio de contra-mercados
Riscos e soluções
A estratégia tem os seguintes riscos:
Os sinais de negociação do MACD podem produzir mais ruído, resultando em negociações excessivamente frequentes. A solução é ajustar adequadamente os parâmetros do MACD e suavizar a curva.
A configuração inadequada do filtro RSI pode causar oportunidades de negociação perdidas. A solução é testar os parâmetros RSI mais adequados.
A solução é ajustar o limite de parada de acordo com a volatilidade do mercado e as preferências de risco pessoais.
A forte volatilidade dos preços no curto prazo pode levar a grandes perdas. A solução é usar opções ou outros instrumentos financeiros para se proteger.
Direção de otimização
A estratégia pode ser melhorada em vários aspectos:
Optimizar os parâmetros MACD, suavizar a curva MACD, reduzir o ruído do sinal
Otimizar ou melhorar o filtro RSI para melhorar o efeito FILTER
Tente outros sinais de confirmação de indicadores, como KD, Brincadeira, etc.
Optimizar a estratégia de stop loss e implementar stop loss de rastreamento dinâmico
Otimização de parâmetros usando métodos como aprendizado de máquina
Cobrança de prazo com instrumentos como índices de ações, futuros e opções
Resumir
Esta estratégia utiliza um conjunto de indicadores MACD e RSI para determinar a tendência, o filtro de sobrevenda e venda e o rastreamento de perdas, para controlar efetivamente o risco de negociação. Esta estratégia pode ser otimizada com maior espaço e espera-se obter melhores resultados de negociação por meio de ajustes de parâmetros e introdução de novos indicadores.
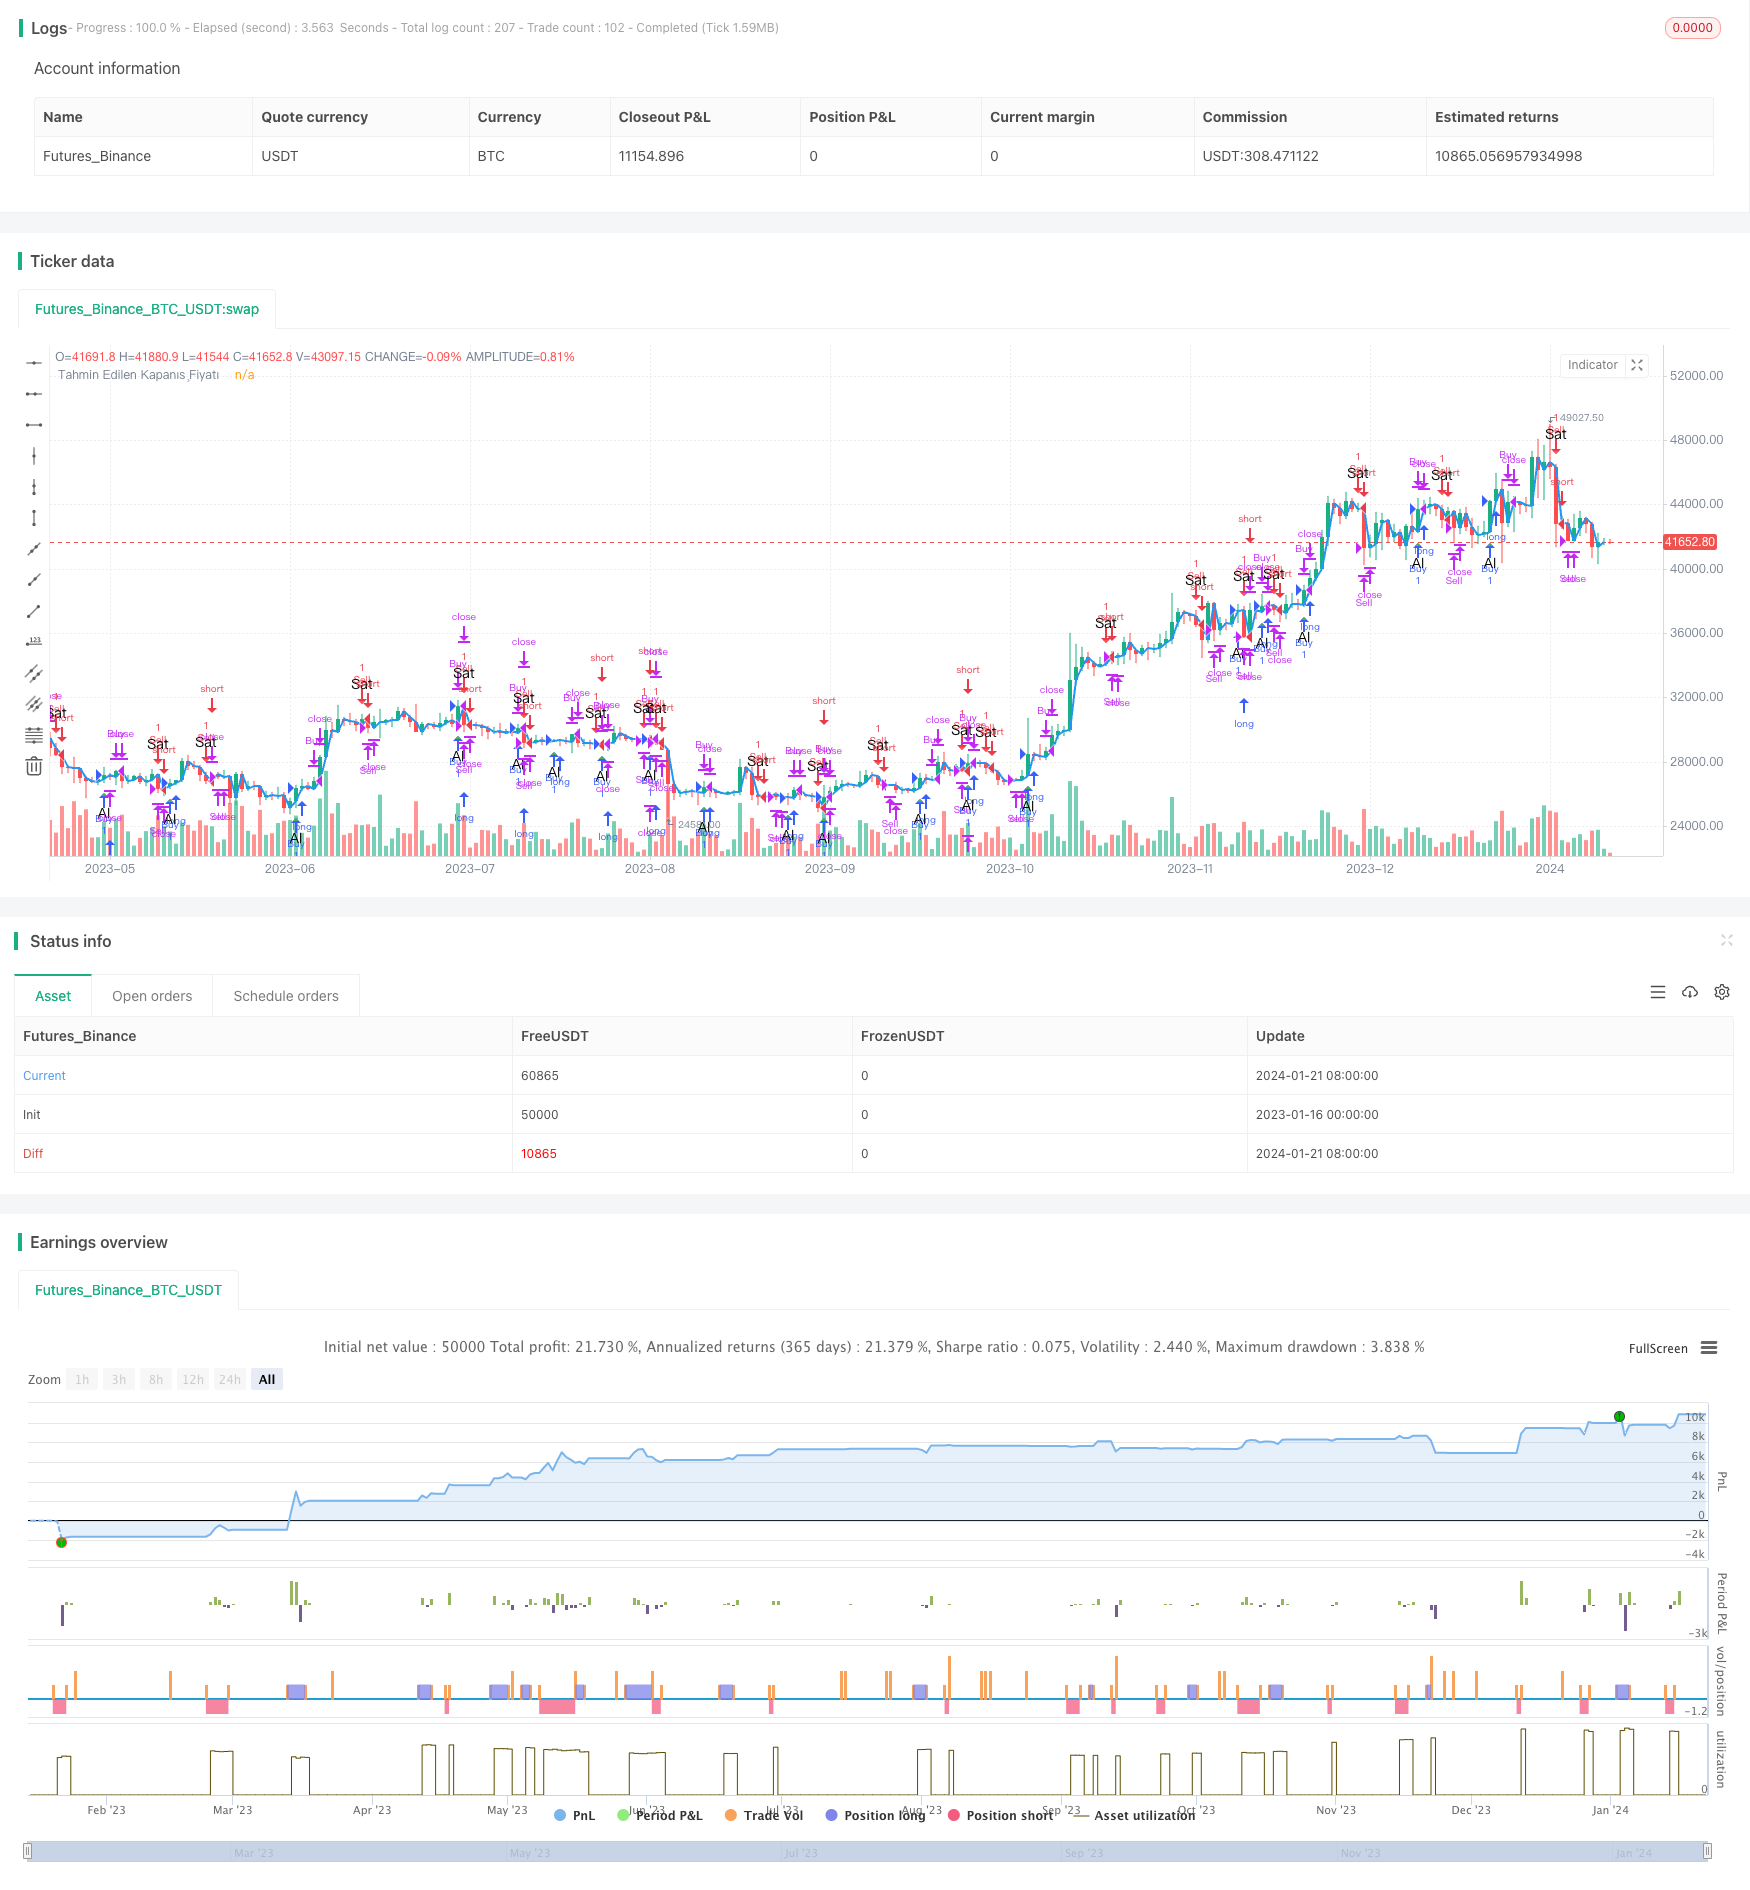
/*backtest
start: 2023-01-16 00:00:00
end: 2024-01-22 00:00:00
period: 1d
basePeriod: 1h
exchanges: [{"eid":"Futures_Binance","currency":"BTC_USDT"}]
*/

//@version=5
strategy("Al-Sat Sinyali ve Teyidi", overlay=true)

// MACD (Hareketli Ortalama Yakınsaklık Sapma)
[macdLine, signalLine, _] = ta.macd(close, 5, 13, 5)

// RSI (Göreceli Güç Endeksi)
rsiValue = ta.rsi(close, 14)

// RSI Filtresi
rsiOverbought = rsiValue > 70
rsiOversold = rsiValue < 30

// MACD Sinyalleri
buySignalMACD = ta.crossover(macdLine, signalLine) and not rsiOverbought
sellSignalMACD = ta.crossunder(macdLine, signalLine) and not rsiOversold

// Al-Sat Stratejisi
if (buySignalMACD and close[1] != close) // Al sinyali ve bir önceki mumdan farklı renkte ise
    strategy.entry("Buy", strategy.long)

if (sellSignalMACD and close[1] != close) // Sat sinyali ve bir önceki mumdan farklı renkte ise
    strategy.entry("Sell", strategy.short)

// Teyit için bir sonraki mumu bekleme
strategy.close("Buy", when=ta.crossover(close, open))
strategy.close("Sell", when=ta.crossunder(close, open))

// Varsayımsal bir sonraki mumun kapanış fiyatını hesapla
nextBarClose = close[1]
plot(nextBarClose, color=color.blue, linewidth=2, title="Tahmin Edilen Kapanış Fiyatı")

// Görselleştirmeyi devre dışı bırakma
plot(na)

// Al-Sat Etiketleri
plotshape(series=buySignalMACD, title="Al Sinyali", color=color.green, style=shape.triangleup, location=location.belowbar, size=size.small, text="Al")
plotshape(series=sellSignalMACD, title="Sat Sinyali", color=color.red, style=shape.triangledown, location=location.abovebar, size=size.small, text="Sat")