A estratégia do indicador Murphy que viaja através do tempo e do espaço
Visão geral
Esta é uma estratégia de quantificação simples que utiliza o índice de Morpheus para identificar os grandes peixes de baleia no mercado. Aplica-se a um período de 5 minutos e é usado principalmente para transações de criptomoedas.
Princípio da estratégia
A estratégia usa um indicador de Morpheus de 3 pontos de comprimento, definindo a linha de sobrecompra como 100 e a linha de sobrevenda como 0. A estratégia espera que o indicador de Morpheus atinja o nível de sobrecompra, indicando a presença de uma grande barra de tubarões no mercado. Se dois indicadores de Morpheus forem sobrecomprados no dia anterior, o preço ainda pode manter a tendência, então é um sinal de entrada múltipla.
Quando o índice de Mofi = 100 e a linha K subjacente é a linha do sol maior, faça uma entrada adicional. A linha de parada de perda é definida como o ponto mais baixo do dia de negociação e termina 60 minutos após a entrada.
Para o lado do shorting, pode-se usar a lógica do espelho. Ou seja, quando o indicador de Moffie atinge o oversell, a linha K inferior é a linha do big shadow, o shorting entra.
Vantagens estratégicas
O uso do índice de Morpheus permite identificar de forma eficaz o comportamento de grandes baleias no mercado, que acumulam ações com potencial de crescimento.
O uso de pontos de ruptura de forte identificação de entidades de linha K permite filtrar muitas rupturas falsas.
Combinado com o filtro SMA, evitar a compra de ações com tendência de queda pode efetivamente reduzir o risco de negociação.
Usando o método de operação de linha ultra curta no dia, a parada de 60 minutos pode bloquear rapidamente os lucros e reduzir a probabilidade de retirada.
Risco estratégico
Os indicadores de Morpheus podem gerar falsos sinais, resultando em prejuízos desnecessários. Pode-se ajustar os parâmetros adequadamente ou adicionar outros indicadores para filtragem.
60 minutos de operação ultra curta METHOD Pode ser muito radical e não é adequado para ações com alta volatilidade. O tempo de parada pode ser ajustado adequadamente ou o uso de stop loss móvel pode ser otimizado.
Não se tem em conta o risco de choque de mercado em caso de acontecimentos macroeconômicos significativos.
Direção de otimização da estratégia
Pode-se testar diferentes combinações de parâmetros, como ajustar o comprimento do indicador de Morpheus, otimizar os parâmetros do ciclo SMA, etc.
Tente adicionar outros indicadores em uma combinação, como o canal BOLL, o indicador KD, etc., para ver se pode melhorar a precisão do sinal.
Testar se a flexibilidade apropriada do Stop Loss permite obter maiores lucros individuais.
Tente desenvolver versões para outros ciclos com base na estrutura da estratégia, como as versões de 15 minutos ou 30 minutos.
Resumir
A estratégia é muito simples e fácil de entender em geral, e o conceito básico é o mesmo que o clássico de rastrear e caçar grandes tubarões. Identificando os pontos críticos de sobrecompra e sobrevenda do indicador de Morpheus, em conjunto com a filtragem de entidades de linha K, é possível filtrar muitos ruídos. A adição do filtro SMA também melhora ainda mais a estabilidade da estratégia.
O método de operação ultra-curta de 60 minutos pode ser rapidamente lucrativo, mas também traz um alto risco operacional. No geral, é um modelo de estratégia quantitativa de grande valor no campo de batalha, que vale a pena estudar e otimizar, e também nos fornece ideias valiosas para o desenvolvimento de estratégias.
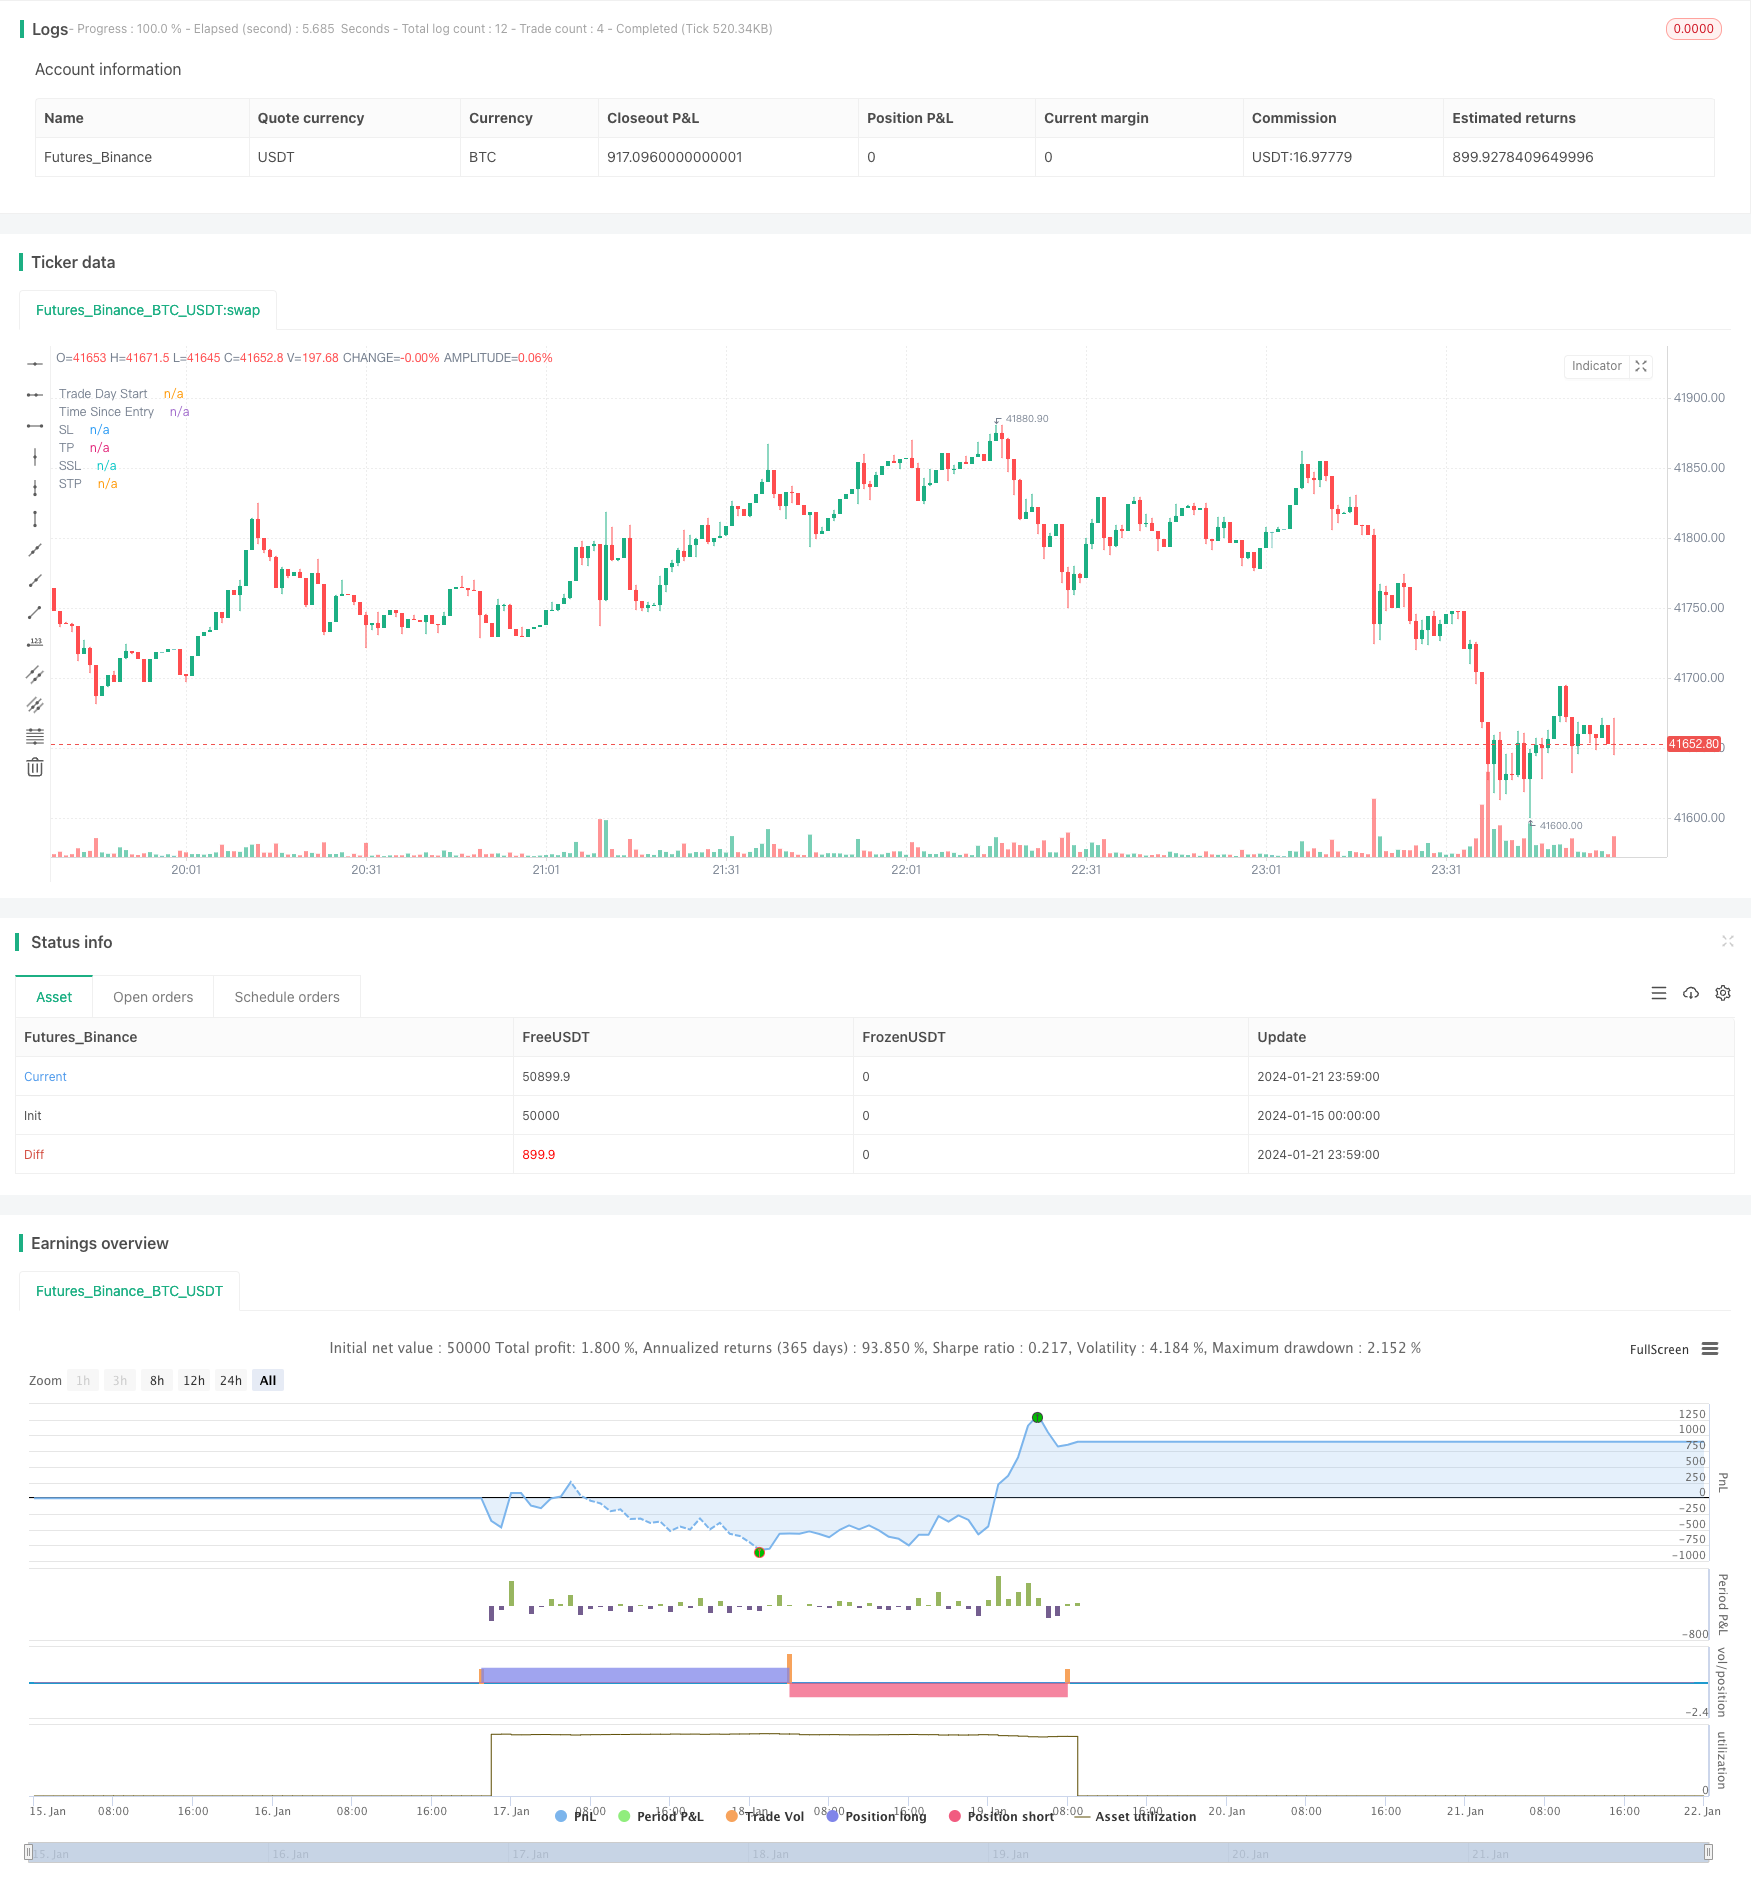
/*backtest
start: 2024-01-15 00:00:00
end: 2024-01-22 00:00:00
period: 1m
basePeriod: 1m
exchanges: [{"eid":"Futures_Binance","currency":"BTC_USDT"}]
*/

// This source code is subject to the terms of the Mozilla Public License 2.0 at https://mozilla.org/MPL/2.0/

// From "Crypto Day Trading Strategy" PDF file.

// * I'm using a SMA filter to avoid buying when the price is declining. Time frame was better at 15 min according to my test.

// 1 - Apply the 3 period Money Flow Index indicator to the 5 minute chart, using 0 and 100 as our oversold and overbought boundaries
// 2 - Wait for the MFI to reach overbought levels, that indicates the presence of "big sharks" in the market. Price needs to hold up
// the first two MFI overbought occurrences of the day to be considered as a bullish entry signal.*
// 3 - We buy when the MFI = 100 and the next candle is a bullish candle with short wicks.
// 4 - We place our Stop Loss below the low of the trading day and we Take Profit during the first 60 minutes after taking the trade.

// The logic above can be used in a mirrored fashion to take short entries, this is a custom parameter that can be modified from
// the strategy Inputs panel.

// © tweakerID

//@version=4
strategy("Money Flow Index 5 min Strategy",
     overlay=true )

direction = input(0, title = "Strategy Direction", type=input.integer, minval=-1, maxval=1)
strategy.risk.allow_entry_in(direction == 0 ? strategy.direction.all : (direction < 0 ? strategy.direction.short : strategy.direction.long))

/////////////////////// STRATEGY INPUTS ////////////////////////////////////////
title1=input(true, "-----------------Strategy Inputs-------------------")

i_MFI = input(3, title="MFI Length")
OB=input(100, title="Overbought Level")
OS=input(0, title="Oversold Level")
barsizeThreshold=input(.5, step=.05, minval=.1, maxval=1, title="Bar Body Size, 1=No Wicks")
i_MAFilter = input(true, title="Use MA Trend Filter")
i_MALen = input(80, title="MA Length")
i_timedexit=input(false, title="Use 60 minutes exit rule")
short=input(true, title="Use Mirrored logic for Shorts")

/////////////////////// BACKTESTER /////////////////////////////////////////////
title2=input(true, "-----------------General Inputs-------------------")

// Backtester General Inputs
i_SL=input(true, title="Use Stop Loss and Take Profit")
i_SLType=input(defval="Strategy Stop", title="Type Of Stop", options=["Strategy Stop", "Swing Lo/Hi", "ATR Stop"])
i_SPL=input(defval=10, title="Swing Point Lookback")
i_PercIncrement=input(defval=3, step=.1, title="Swing Point SL Perc Increment")*0.01
i_ATR = input(14, title="ATR Length")
i_ATRMult = input(5, step=.1, title="ATR Multiple")
i_TPRRR = input(2.2, step=.1, title="Take Profit Risk Reward Ratio")
TS=input(false, title="Trailing Stop")

// Bought and Sold Boolean Signal
bought = strategy.position_size > strategy.position_size[1]
 or strategy.position_size < strategy.position_size[1]

// Price Action Stop and Take Profit
LL=(lowest(i_SPL))*(1-i_PercIncrement)
HH=(highest(i_SPL))*(1+i_PercIncrement)
LL_price = valuewhen(bought, LL, 0)
HH_price = valuewhen(bought, HH, 0)
entry_LL_price = strategy.position_size > 0 ? LL_price : na
entry_HH_price = strategy.position_size < 0 ? HH_price : na
tp=strategy.position_avg_price + (strategy.position_avg_price - entry_LL_price)*i_TPRRR
stp=strategy.position_avg_price - (entry_HH_price - strategy.position_avg_price)*i_TPRRR

// ATR Stop
ATR=atr(i_ATR)*i_ATRMult
ATRLong = ohlc4 - ATR
ATRShort = ohlc4 + ATR
ATRLongStop = valuewhen(bought, ATRLong, 0)
ATRShortStop = valuewhen(bought, ATRShort, 0)
LongSL_ATR_price = strategy.position_size > 0 ? ATRLongStop : na
ShortSL_ATR_price = strategy.position_size < 0 ? ATRShortStop : na
ATRtp=strategy.position_avg_price + (strategy.position_avg_price - LongSL_ATR_price)*i_TPRRR
ATRstp=strategy.position_avg_price - (ShortSL_ATR_price - strategy.position_avg_price)*i_TPRRR


// Strategy Stop
DayStart = time == timestamp("UTC", year, month, dayofmonth, 0, 0, 0)
plot(DayStart ? 1e9 : na, style=plot.style_columns, color=color.silver, transp=80, title="Trade Day Start")
float LongStop = valuewhen(DayStart,low,0)*(1-i_PercIncrement)
float ShortStop = valuewhen(DayStart,high,0)*(1+i_PercIncrement)
float StratTP = strategy.position_avg_price + (strategy.position_avg_price - LongStop)*i_TPRRR
float StratSTP = strategy.position_avg_price - (ShortStop - strategy.position_avg_price)*i_TPRRR

/////////////////////// STRATEGY LOGIC /////////////////////////////////////////

MFI=mfi(close,i_MFI)
barsize=high-low
barbodysize=close>open?(open-close)*-1:(open-close)
shortwicksbar=barbodysize>barsize*barsizeThreshold
SMA=sma(close, i_MALen)
MAFilter=close > SMA
timesinceentry=(time - valuewhen(bought, time, 0)) / 60000
timedexit=timesinceentry == 60

BUY = MFI[1] == OB and close > open and shortwicksbar and (i_MAFilter ? MAFilter : true)
bool SELL = na
if short
    SELL := MFI[1] == OS and close < open and shortwicksbar and (i_MAFilter ? not MAFilter : true)

//Debugging Plots
plot(timesinceentry, transp=100, title="Time Since Entry")

//Trading Inputs
DPR=input(true, "Allow Direct Position Reverse")
reverse=input(false, "Reverse Trades")

// Entries
if reverse
    if not DPR
        strategy.entry("long", strategy.long, when=SELL and strategy.position_size == 0)
        strategy.entry("short", strategy.short, when=BUY and strategy.position_size == 0)
    else
        strategy.entry("long", strategy.long, when=SELL)
        strategy.entry("short", strategy.short, when=BUY)
else
    if not DPR
        strategy.entry("long", strategy.long, when=BUY and strategy.position_size == 0)
        strategy.entry("short", strategy.short, when=SELL and strategy.position_size == 0)
    else
        strategy.entry("long", strategy.long, when=BUY)
        strategy.entry("short", strategy.short, when=SELL)
if i_timedexit
    strategy.close_all(when=timedexit)

SL= i_SLType == "Swing Lo/Hi" ? entry_LL_price : i_SLType == "ATR Stop" ? LongSL_ATR_price : LongStop
SSL= i_SLType == "Swing Lo/Hi" ? entry_HH_price : i_SLType == "ATR Stop" ? ShortSL_ATR_price : ShortStop
TP= i_SLType == "Swing Lo/Hi" ? tp : i_SLType == "ATR Stop" ? ATRtp : StratTP
STP= i_SLType == "Swing Lo/Hi" ? stp : i_SLType == "ATR Stop" ? ATRstp : StratSTP

//TrailingStop
dif=(valuewhen(strategy.position_size>0 and strategy.position_size[1]<=0, high,0))
 -strategy.position_avg_price
trailOffset     = strategy.position_avg_price - SL
var tstop = float(na)
if strategy.position_size > 0
    tstop := high- trailOffset - dif
    if tstop<tstop[1]
        tstop:=tstop[1]
else
    tstop := na
StrailOffset     = SSL - strategy.position_avg_price
var Ststop = float(na)
Sdif=strategy.position_avg_price-(valuewhen(strategy.position_size<0
 and strategy.position_size[1]>=0, low,0))
if strategy.position_size < 0
    Ststop := low+ StrailOffset + Sdif
    if Ststop>Ststop[1]
        Ststop:=Ststop[1]
else
    Ststop := na

strategy.exit("TP & SL", "long", limit=TP, stop=TS? tstop : SL, when=i_SL)
strategy.exit("TP & SL", "short", limit=STP, stop=TS? Ststop : SSL, when=i_SL)

/////////////////////// PLOTS //////////////////////////////////////////////////

plot(i_SL and strategy.position_size > 0 and not TS ? SL : i_SL and strategy.position_size > 0 and TS ? tstop : na , title='SL', style=plot.style_cross, color=color.red)
plot(i_SL and strategy.position_size < 0 and not TS ? SSL : i_SL and strategy.position_size < 0 and TS ? Ststop : na , title='SSL', style=plot.style_cross, color=color.red)
plot(i_SL and strategy.position_size > 0 ? TP : na, title='TP', style=plot.style_cross, color=color.green)
plot(i_SL and strategy.position_size < 0 ? STP : na, title='STP', style=plot.style_cross, color=color.green)
// Draw price action setup arrows
plotshape(BUY ? 1 : na, style=shape.triangleup, location=location.belowbar,
 color=color.green, title="Bullish Setup", size=size.auto)
plotshape(SELL ? 1 : na, style=shape.triangledown, location=location.abovebar,
 color=color.red, title="Bearish Setup", size=size.auto)