Estratégia de acompanhamento de tendências com média móvel dupla e crossover StochRSI
Visão geral
A estratégia combina o uso de médias móveis duplas e o indicador StochRSI para identificar a direção da tendência e os pontos de entrada. A principal característica é que é possível entrar no mercado no início da tendência, ao mesmo tempo em que se utiliza a característica de supercompra e supervenda do indicador StochRSI para filtrar falsas rupturas.
Princípio da estratégia
A estratégia usa a média móvel rápida (EMA) 12 e a média móvel lenta (EMA) 25 para construir um sistema de média móvel dupla, que gera um sinal de compra quando a linha rápida atravessa a linha lenta e um sinal de venda quando a linha rápida atravessa a linha lenta, para determinar a direção da grande tendência.
Ao mesmo tempo, a estratégia combina o cruzamento do indicador StochRSI para identificar ainda mais o momento de entrada. O indicador StochRSI combina os indicadores aleatórios KDJ e RSI, gerando um sinal de compra quando a linha K atravessa a linha D a partir da zona de superalimento e um sinal de venda quando a linha K atravessa a linha D a partir da zona de superalimento.
A estratégia só abre uma posição quando a média móvel dupla produz um sinal e o StochRSI também produz um sinal correspondente. Assim, é possível filtrar efetivamente algumas falsas brechas e evitar negociações inválidas.
Análise de vantagens
A maior vantagem da estratégia é a capacidade de determinar a direção da tendência e os potenciais pontos de entrada mais cedo. O sistema de médias móveis pode gerar sinais no início da tendência, enquanto a inclusão do indicador StochRSI pode filtrar eficazmente as falsas rupturas e evitar erros de negociação.
Além disso, a estratégia combina a análise de tendências e o julgamento de overbought e oversold, com os benefícios de acompanhar tendências e inverter as negociações. A estratégia pode capturar todas as oportunidades, seja acompanhando tendências ou comprando em baixa e vendendo em alta.
Análise de Riscos
O principal risco da estratégia reside na própria atraso do sistema de médias móveis. Quando a situação muda drasticamente, o sistema de médias móveis duplas geralmente demora um pouco para gerar sinais, o que facilita que a estratégia perca o melhor momento de entrada.
Além disso, o StochRSI pode gerar sinais errados, levando a negociações desnecessárias. Especialmente em períodos de turbulência, as linhas K e D podem se cruzar com frequência, o que coloca a estratégia em risco de demasiadas operações ineficazes.
Direção de otimização
A estratégia de otimização centra-se nas seguintes áreas:
Ajustar os parâmetros das médias móveis duplas para o uso de um período de linha média mais favorável à captura de tendências;
Otimizar os parâmetros do StochRSI para criar critérios mais razoáveis de superaquecimento;
Aumentar a quantidade de peças ou ajustar o nível do stop loss para obter uma maior taxa de retorno;
Combinado com outros indicadores como condições de filtragem, reduz ainda mais os sinais de invalidez.
Resumir
Esta estratégia é muito adequada para capturar tendências de linha média e longa, com grande potencial de lucro no início da tendência. Ao mesmo tempo, em combinação com o indicador StochRSI como julgamento auxiliar, pode filtrar efetivamente os sinais enganosos e evitar perdas desnecessárias. Com a otimização de parâmetros e melhorias na gestão de risco, a estratégia pode ser uma ferramenta poderosa para obter ganhos estáveis.
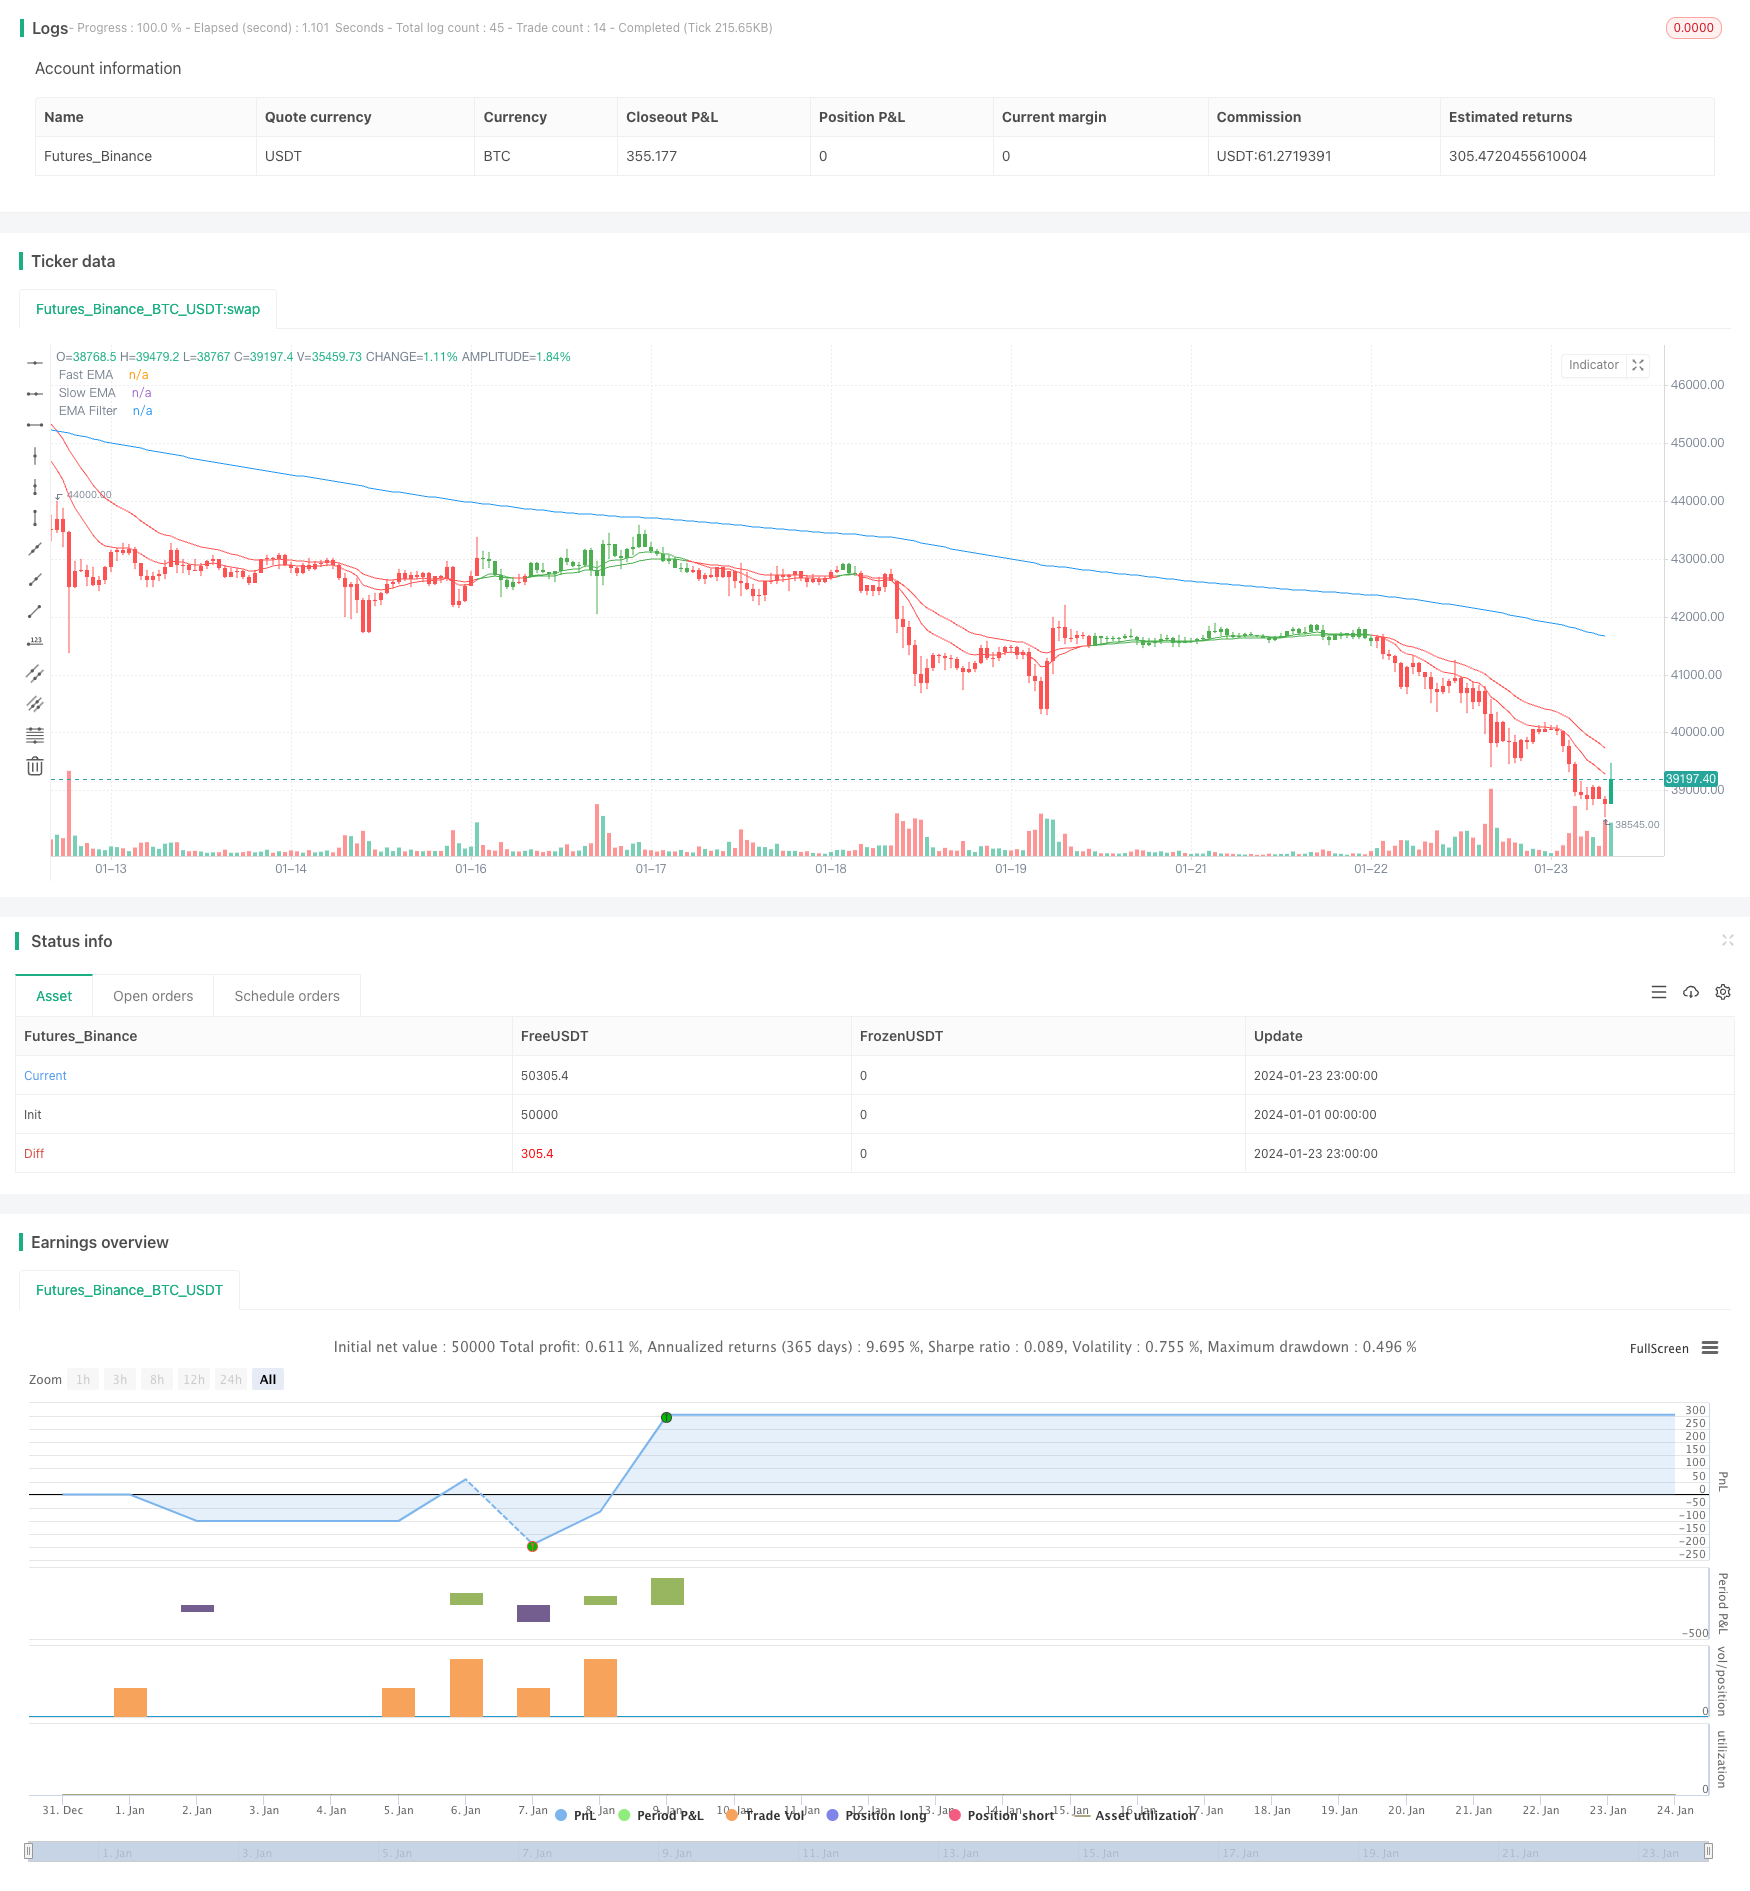
/*backtest
start: 2024-01-01 00:00:00
end: 2024-01-24 00:00:00
period: 1h
basePeriod: 15m
exchanges: [{"eid":"Futures_Binance","currency":"BTC_USDT"}]
*/

// This source code is subject to the terms of the Mozilla Public License 2.0 at https://mozilla.org/MPL/2.0/
// © btc_charlie / @TheParagonGrp

//@version=5
strategy('BlackBit Trader XO Macro Trend Scanner', overlay=true)

// Variables
var ok = 0
var countBuy = 0
var countSell = 0
src = input(close, title='OHLC Type')
i_fastEMA = input(12, title='Fast EMA')
i_slowEMA = input(25, title='Slow EMA')
i_defEMA = input(25, title='Consolidated EMA')

// Allow the option to show single or double EMA
i_bothEMAs = input(title='Show Both EMAs', defval=true)

// Define EMAs
v_fastEMA = ta.ema(src, i_fastEMA)
v_slowEMA = ta.ema(src, i_slowEMA)
v_biasEMA = ta.ema(src, i_defEMA)

// Color the EMAs
emaColor = v_fastEMA > v_slowEMA ? color.green : v_fastEMA < v_slowEMA ? color.red : #FF530D

// Plot EMAs
plot(i_bothEMAs ? na : v_biasEMA, color=emaColor, linewidth=3, title='Consolidated EMA')
plot(i_bothEMAs ? v_fastEMA : na, title='Fast EMA', color=emaColor)
plot(i_bothEMAs ? v_slowEMA : na, title='Slow EMA', color=emaColor)

// Colour the bars
buy = v_fastEMA > v_slowEMA
sell = v_fastEMA < v_slowEMA

if buy
    countBuy += 1
    countBuy

if buy
    countSell := 0
    countSell

if sell
    countSell += 1
    countSell

if sell
    countBuy := 0
    countBuy

buysignal = countBuy < 2 and countBuy > 0 and countSell < 1 and buy and not buy[1]
sellsignal = countSell > 0 and countSell < 2 and countBuy < 1 and sell and not sell[1]

barcolor(buysignal ? color.green : na)
barcolor(sellsignal ? color.red : na)


bull = countBuy > 1
bear = countSell > 1

barcolor(bull ? color.green : na)
barcolor(bear ? color.red : na)

// Set Alerts

// alertcondition(ta.crossover(v_fastEMA, v_slowEMA), title='Bullish EMA Cross', message='Bullish EMA crossover')
// alertcondition(ta.crossunder(v_fastEMA, v_slowEMA), title='Bearish EMA Cross', message='Bearish EMA Crossover')

// Stoch RSI code

smoothK = input.int(3, 'K', minval=1)
smoothD = input.int(3, 'D', minval=1)
lengthRSI = input.int(14, 'RSI Length', minval=1)
lengthStoch = input.int(14, 'Stochastic Length', minval=1)

rsi1 = ta.rsi(src, lengthRSI)
k = ta.sma(ta.stoch(rsi1, rsi1, rsi1, lengthStoch), smoothK)
d = ta.sma(k, smoothD)

bandno0 = input.int(80, minval=1, title='Upper Band', group='Bands (change this instead of length in Style for Stoch RSI colour to work properly)')
bandno2 = input.int(50, minval=1, title='Middle Band', group='Bands (change this instead of length in Style for Stoch RSI colour to work properly)')
bandno1 = input.int(20, minval=1, title='Lower Band', group='Bands (change this instead of length in Style for Stoch RSI colour to work properly)')

// Alerts

crossoverAlertBgColourMidOnOff = input.bool(title='Crossover Alert Background Colour (Middle Level) [ON/OFF]', group='Crossover Alerts', defval=false)
crossoverAlertBgColourOBOSOnOff = input.bool(title='Crossover Alert Background Colour (OB/OS Level) [ON/OFF]', group='Crossover Alerts', defval=false)

crossoverAlertBgColourGreaterThanOnOff = input.bool(title='Crossover Alert >input [ON/OFF]', group='Crossover Alerts', defval=false)
crossoverAlertBgColourLessThanOnOff = input.bool(title='Crossover Alert <input [ON/OFF]', group='Crossover Alerts', defval=false)

maTypeChoice = input.string('EMA', title='MA Type', group='Moving Average', options=['EMA', 'WMA', 'SMA', 'None'])
maSrc = input.source(close, title='MA Source', group='Moving Average')
maLen = input.int(200, minval=1, title='MA Length', group='Moving Average')

maValue = if maTypeChoice == 'EMA'
    ta.ema(maSrc, maLen)
else if maTypeChoice == 'WMA'
    ta.wma(maSrc, maLen)
else if maTypeChoice == 'SMA'
    ta.sma(maSrc, maLen)
else
    0

crossupCHECK = maTypeChoice == 'None' or open > maValue and maTypeChoice != 'None'
crossdownCHECK = maTypeChoice == 'None' or open < maValue and maTypeChoice != 'None'

crossupalert = crossupCHECK and ta.crossover(k, d) and (k < bandno2 or d < bandno2)
crossdownalert = crossdownCHECK and ta.crossunder(k, d) and (k > bandno2 or d > bandno2)
crossupOSalert = crossupCHECK and ta.crossover(k, d) and (k < bandno1 or d < bandno1)
crossdownOBalert = crossdownCHECK and ta.crossunder(k, d) and (k > bandno0 or d > bandno0)

aboveBandalert = ta.crossunder(k, bandno0)
belowBandalert = ta.crossover(k, bandno1)

bgcolor(color=crossupalert and crossoverAlertBgColourMidOnOff ? #4CAF50 : crossdownalert and crossoverAlertBgColourMidOnOff ? #FF0000 : na, title='Crossover Alert Background Colour (Middle Level)', transp=70)
bgcolor(color=crossupOSalert and crossoverAlertBgColourOBOSOnOff ? #fbc02d : crossdownOBalert and crossoverAlertBgColourOBOSOnOff ? #000000 : na, title='Crossover Alert Background Colour (OB/OS Level)', transp=70)

bgcolor(color=aboveBandalert and crossoverAlertBgColourGreaterThanOnOff ? #ff0014 : crossdownalert and crossoverAlertBgColourMidOnOff ? #FF0000 : na, title='Crossover Alert - K > Upper level', transp=70)
bgcolor(color=belowBandalert and crossoverAlertBgColourLessThanOnOff ? #4CAF50 : crossdownalert and crossoverAlertBgColourMidOnOff ? #FF0000 : na, title='Crossover Alert - K < Lower level', transp=70)

// alertcondition(crossupalert or crossdownalert, title='Stoch RSI Crossover', message='STOCH RSI CROSSOVER')

// Calculate start/end date and time condition
startDate = input(timestamp('2000-12-24T00:00:00'),group = "---------TIME RANGE SETTINGS---------")
finishDate = input(timestamp('2029-02-26T00:00:00'),group = "---------TIME RANGE SETTINGS---------")
time_cond = true


//ema filter
emalen = input(200,"EMA Filter Length",group = "EMA FILTER SETTINGS")
emasource = input(close,"EMA Filter Source",group = "EMA FILTER SETTINGS")
ema_fil = ta.ema(emasource,emalen)
plot(ema_fil,"EMA Filter")

//macd
fast_length = input(title="Fast Length", defval=26,group = "MACD FILTER SETTINGS")
slow_length = input(title="Slow Length", defval=100,group = "MACD FILTER SETTINGS")
src_macd = input(title="Source", defval=close,group = "MACD FILTER SETTINGS")
signal_length = input.int(title="Signal Smoothing",  minval = 1, maxval = 50, defval = 9,group = "MACD FILTER SETTINGS")
sma_source = input.string(title="Oscillator MA Type",  defval="EMA", options=["SMA", "EMA"],group = "MACD FILTER SETTINGS")
sma_signal = input.string(title="Signal Line MA Type", defval="EMA", options=["SMA", "EMA"],group = "MACD FILTER SETTINGS")

// Calculating
fast_ma = sma_source == "SMA" ? ta.sma(src_macd, fast_length) : ta.ema(src_macd, fast_length)
slow_ma = sma_source == "SMA" ? ta.sma(src_macd, slow_length) : ta.ema(src_macd, slow_length)
macd = fast_ma - slow_ma
signal = sma_signal == "SMA" ? ta.sma(macd, signal_length) : ta.ema(macd, signal_length)
hist = macd - signal

//tpsl
takeprofit=input.float(defval=0.3,title="Enter The Take Profit %",group="TP/SL CONDITION INPUTS HERE")/100
stoploss=input.float(defval=0.16,title="Enter The Stop %",group="TP/SL CONDITION INPUTS HERE")/100
tp = strategy.opentrades.entry_price(0)*takeprofit/syminfo.mintick
sl = strategy.opentrades.entry_price(0)*stoploss/syminfo.mintick

lg_rule = buysignal and hist > 0 and close > ema_fil
sh_rule = sellsignal and hist < 0 and close < ema_fil

// Plot Bull/Bear

plotshape(lg_rule, title='Bull', text='Bull', style=shape.triangleup, location=location.belowbar, color=color.new(color.green, 0), textcolor=color.new(color.black, 0), size=size.tiny)
plotshape(sh_rule, title='Bear', text='Bear', style=shape.triangledown, location=location.abovebar, color=color.new(color.red, 0), textcolor=color.new(color.black, 0), size=size.tiny)

//alert
lg_entryal = input("Long entry","Long entry alert",group = "ALERT MESSAGE SETTINGS")
sh_entryal = input("Short entry","Short entry alert",group = "ALERT MESSAGE SETTINGS")

if lg_rule and time_cond and barstate.isconfirmed
    strategy.entry("LONG",strategy.long)
    alert(lg_entryal,alert.freq_once_per_bar_close)
if strategy.position_size > 0
    strategy.exit("LONG EX","LONG",loss = sl,profit = tp,comment_loss = "LONG SL",comment_profit = "LONG TP")

if sh_rule and time_cond and barstate.isconfirmed
    strategy.entry("SHORT",strategy.short)
    alert(sh_entryal,alert.freq_once_per_bar_close)

if strategy.position_size < 0
    strategy.exit("SHORT EX","SHORT",loss = sl,profit = tp,comment_loss = "SHORT SL",comment_profit = "SHORT TP")

//end