Estratégia de negociação de swing de suporte e resistência
Data de criação:
2024-01-25 15:53:06
última modificação:
2024-01-25 15:53:06
cópia:
2
Cliques:
603
1
focar em
1750
Seguidores
Visão geral
Esta estratégia permite um controle preciso da lógica de negociação e um stop loss preciso, combinando estratégias de cruzamento de RSI e indicadores aleatórios com estratégias de otimização de pontos de liquidação. Ao mesmo tempo, a introdução de otimização de sinais permite um melhor controle da tendência e uma gestão racional do capital.
Princípio da estratégia
- O indicador RSI julga as áreas de sobrevenda e sobrevenda, combinando os valores K e D do indicador aleatório para formar um sinal de negociação.
- Introdução de identificação de tipo de linha K para auxiliar na determinação de sinais de tendência e evitar erros de negociação.
- A linha média SMA ajuda a determinar a direção da tendência. Quando a linha média de curto prazo se move de baixo para cima, a linha média de longo prazo é um sinal de otimismo.
- A estratégia de ponto de deslizamento de posição plana, baseada na maior e menor faixa de flutuação do preço, define o preço de parada de perda.
Análise de vantagens
- Parâmetros do RSI são otimizados para determinar áreas de sobrecompra e sobrevenda e evitar erros de negociação
- Parâmetros de otimização de indicadores STO, regulação de parâmetros de suavidade, para eliminar o ruído e melhorar a qualidade do sinal
- Introdução da análise técnica Heikin-Ashi para identificar mudanças de direção de entidades de linha K e garantir a precisão do sinal de negociação
- A linha média SMA ajuda a determinar a direção da grande tendência, evitando negociações adversas
- Combinado com uma estratégia de ponto de deslizamento de stop-loss, para maximizar o lucro em cada transação
Análise de Riscos
- Os fundos estão em maior risco quando a Bolsa continua em queda
- Frequência de transações pode ser excessiva, aumentando custos de transação e custos de deslizamento
- O RSI é propenso a falsos sinais e deve ser filtrado em combinação com outros indicadores
Otimização de Estratégia
- Ajustar os parâmetros do RSI para otimizar os julgamentos de sobrecompra e sobrevenda
- Ajustar os parâmetros do indicador STO, suavidade e ciclo para melhorar a qualidade do sinal
- Ajustar o ciclo da média móvel para otimizar o julgamento de tendências
- A introdução de mais indicadores técnicos para melhorar a precisão do julgamento de sinais
- Optimizar a Stop Loss Ratio e reduzir o risco de transação única
Resumir
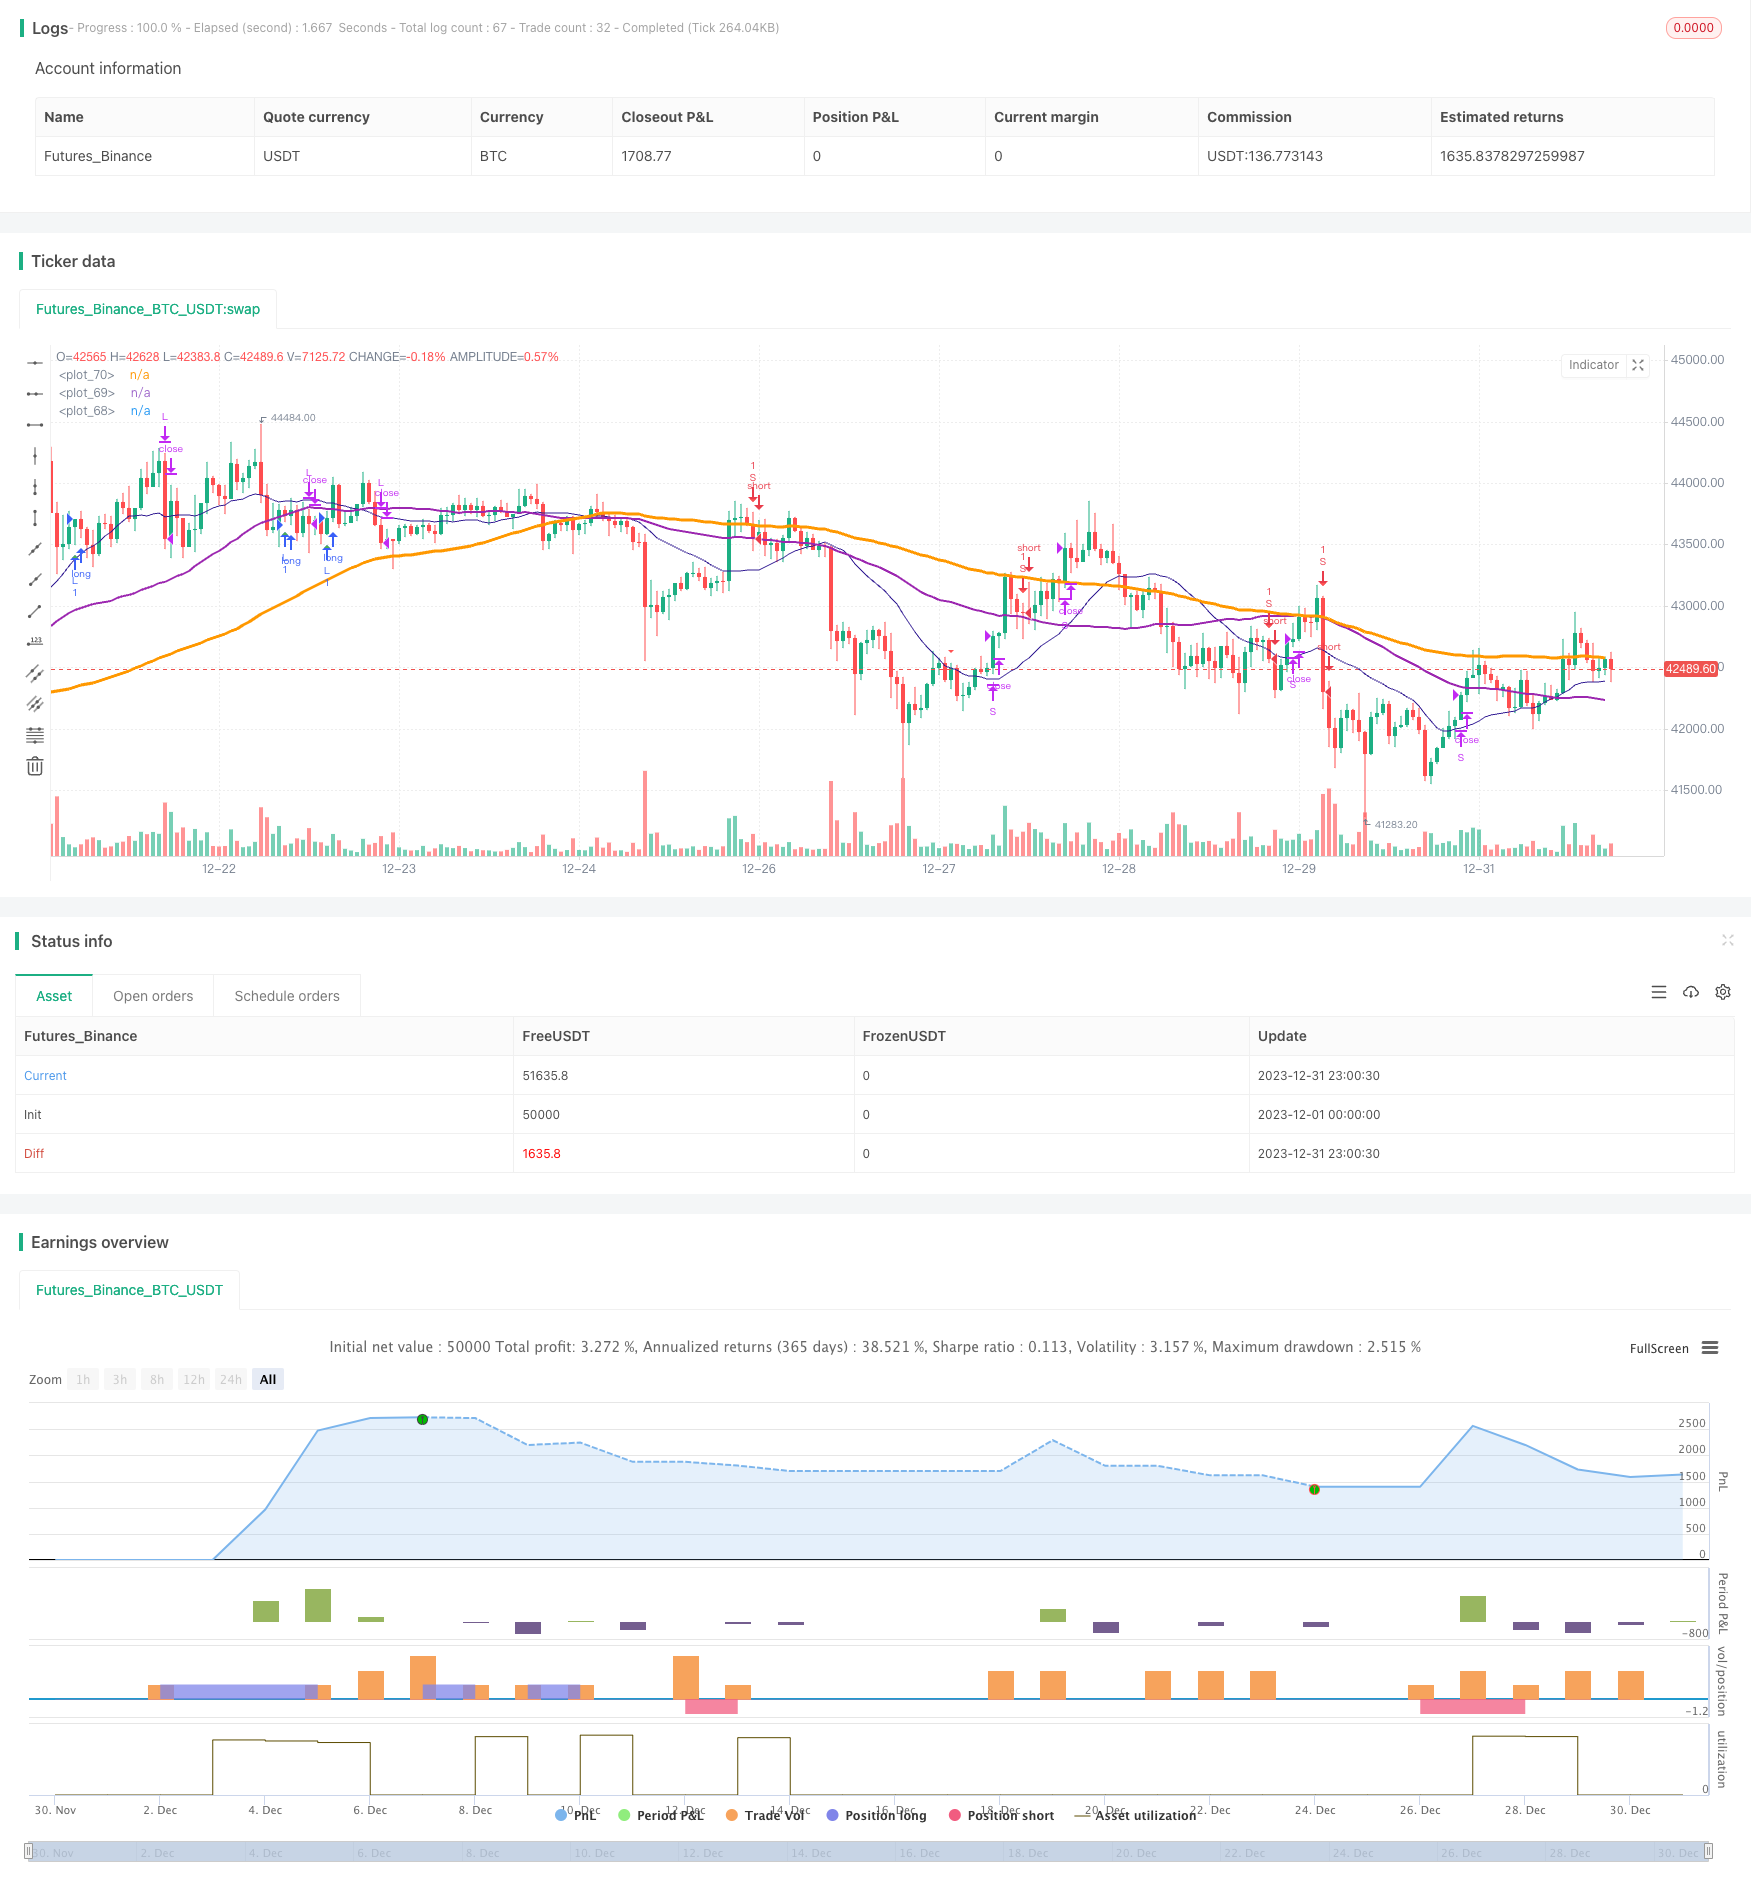
A estratégia integra as vantagens de vários indicadores tecnológicos principais, obtendo um equilíbrio entre a qualidade do sinal de negociação e o stop loss através da otimização de parâmetros e aperfeiçoamento de regras. Tem uma certa universalidade e capacidade de lucratividade estável. Com otimização contínua, pode aumentar ainda mais a taxa de vitória e a taxa de lucro.
Código-fonte da estratégia
/*backtest
start: 2023-12-01 00:00:00
end: 2023-12-31 23:59:59
period: 1h
basePeriod: 15m
exchanges: [{"eid":"Futures_Binance","currency":"BTC_USDT"}]
*/

//@version=4
//study(title="@sentenzal strategy", shorttitle="@sentenzal strategy", overlay=true)
strategy(title="@sentenzal strategy", shorttitle="@sentenzal strategy", overlay=true  )
smoothK = input(3, minval=1)
smoothD = input(3, minval=1)
lengthRSI = input(14, minval=1)
lengthStoch = input(14, minval=1)
overbought = input(80, minval=1)
oversold = input(20, minval=1)
smaLengh = input(100, minval=1)
smaLengh2 = input(50, minval=1)
smaLengh3 = input(20, minval=1)

src = input(close, title="RSI Source")
testStartYear = input(2017, "Backtest Start Year")
testStartMonth = input(1, "Backtest Start Month")
testStartDay = input(1, "Backtest Start Day")
testPeriodStart = timestamp(testStartYear,testStartMonth,testStartDay,0,0)
testPeriod() =>
    time >= testPeriodStart ? true : false

rsi1 = rsi(src, lengthRSI)
k = sma(stoch(rsi1, rsi1, rsi1, lengthStoch), smoothK)
d = sma(k, smoothD)
crossBuy = crossover(k, d) and k < oversold
crossSell = crossunder(k, d) and k > overbought

dcLower = lowest(low, 10)
dcUpper = highest(high, 10)


heikinashi_close = security(heikinashi(syminfo.tickerid), timeframe.period, close)
heikinashi_open = security(heikinashi(syminfo.tickerid), timeframe.period, open)
heikinashi_low = security(heikinashi(syminfo.tickerid), timeframe.period, low)
heikinashi_high = security(heikinashi(syminfo.tickerid), timeframe.period, high)
heikinashiPositive = heikinashi_close >= heikinashi_open

heikinashiBuy = heikinashiPositive == true and heikinashiPositive[1] == false  and heikinashiPositive[2] == false
heikinashiSell = heikinashiPositive == false and heikinashiPositive[1] == true and heikinashiPositive[2] == true

//plotshape(heikinashiBuy, style=shape.arrowup, color=green, location=location.belowbar, size=size.tiny)
//plotshape(heikinashiSell, style=shape.arrowdown, color=red, location=location.abovebar, size=size.tiny)

buy = (crossBuy == true or crossBuy[1] == true or crossBuy[2] == true) and (heikinashiBuy == true or heikinashiBuy[1] == true or heikinashiBuy[2] == true)
sell = (crossSell == true or crossSell[1] == true or crossSell[2] == true) and (heikinashiSell == true or heikinashiSell[1] == true or heikinashiSell[2] == true)

mult = timeframe.period == '15' ? 4 : 1
mult2 = timeframe.period == '240' ? 0.25 : mult

movingAverage = sma(close, round(smaLengh))
movingAverage2 = sma(close, round(smaLengh2))
movingAverage3 = sma(close, round(smaLengh3))

uptrend = movingAverage < movingAverage2 and movingAverage2 < movingAverage3 and close > movingAverage
downtrend = movingAverage > movingAverage2 and movingAverage2 > movingAverage3 and close < movingAverage

signalBuy = (buy[1] == false and buy[2] == false and buy == true) and uptrend
signalSell = (sell[1] == false and sell[2] == false and sell == true) and downtrend

takeProfitSell = (buy[1] == false and buy[2] == false and buy == true) and uptrend == false
takeProfitBuy = (sell[1] == false and sell[2] == false and sell == true)  and uptrend

plotshape(signalBuy, style=shape.triangleup, color=green, location=location.belowbar, size=size.tiny)
plotshape(signalSell, style=shape.triangledown, color=red, location=location.abovebar, size=size.tiny)


plot(movingAverage, linewidth=3, color=orange, transp=0)
plot(movingAverage2, linewidth=2, color=purple, transp=0)
plot(movingAverage3, linewidth=1, color=navy, transp=0)

alertcondition(signalBuy, title='Signal Buy', message='Signal Buy')
alertcondition(signalSell, title='Signal Sell', message='Signal Sell')


strategy.close("L", when=dcLower[1] > low)
strategy.close("S", when=dcUpper[1] < high)

strategy.entry("L", strategy.long, 1, when = signalBuy and testPeriod() and uptrend)
strategy.entry("S", strategy.short, 1, when = signalSell and testPeriod() and uptrend ==false)

//strategy.exit("Exit Long", from_entry = "L", loss = 25000000, profit=25000000)
//strategy.exit("Exit Short", from_entry = "S", loss = 25000000, profit=25000000)