
A estratégia de barganha dinâmica é uma estratégia de negociação de curto e médio prazo que combina um indicador de média móvel e um modelo de forma de linha K para encontrar oportunidades de negociação através da identificação de pontos de ruptura e pontos de reajuste. A estratégia é adequada para a negociação de produtos financeiros de alto nível, como opções de compra e venda, opções de compra e venda, e futuros.
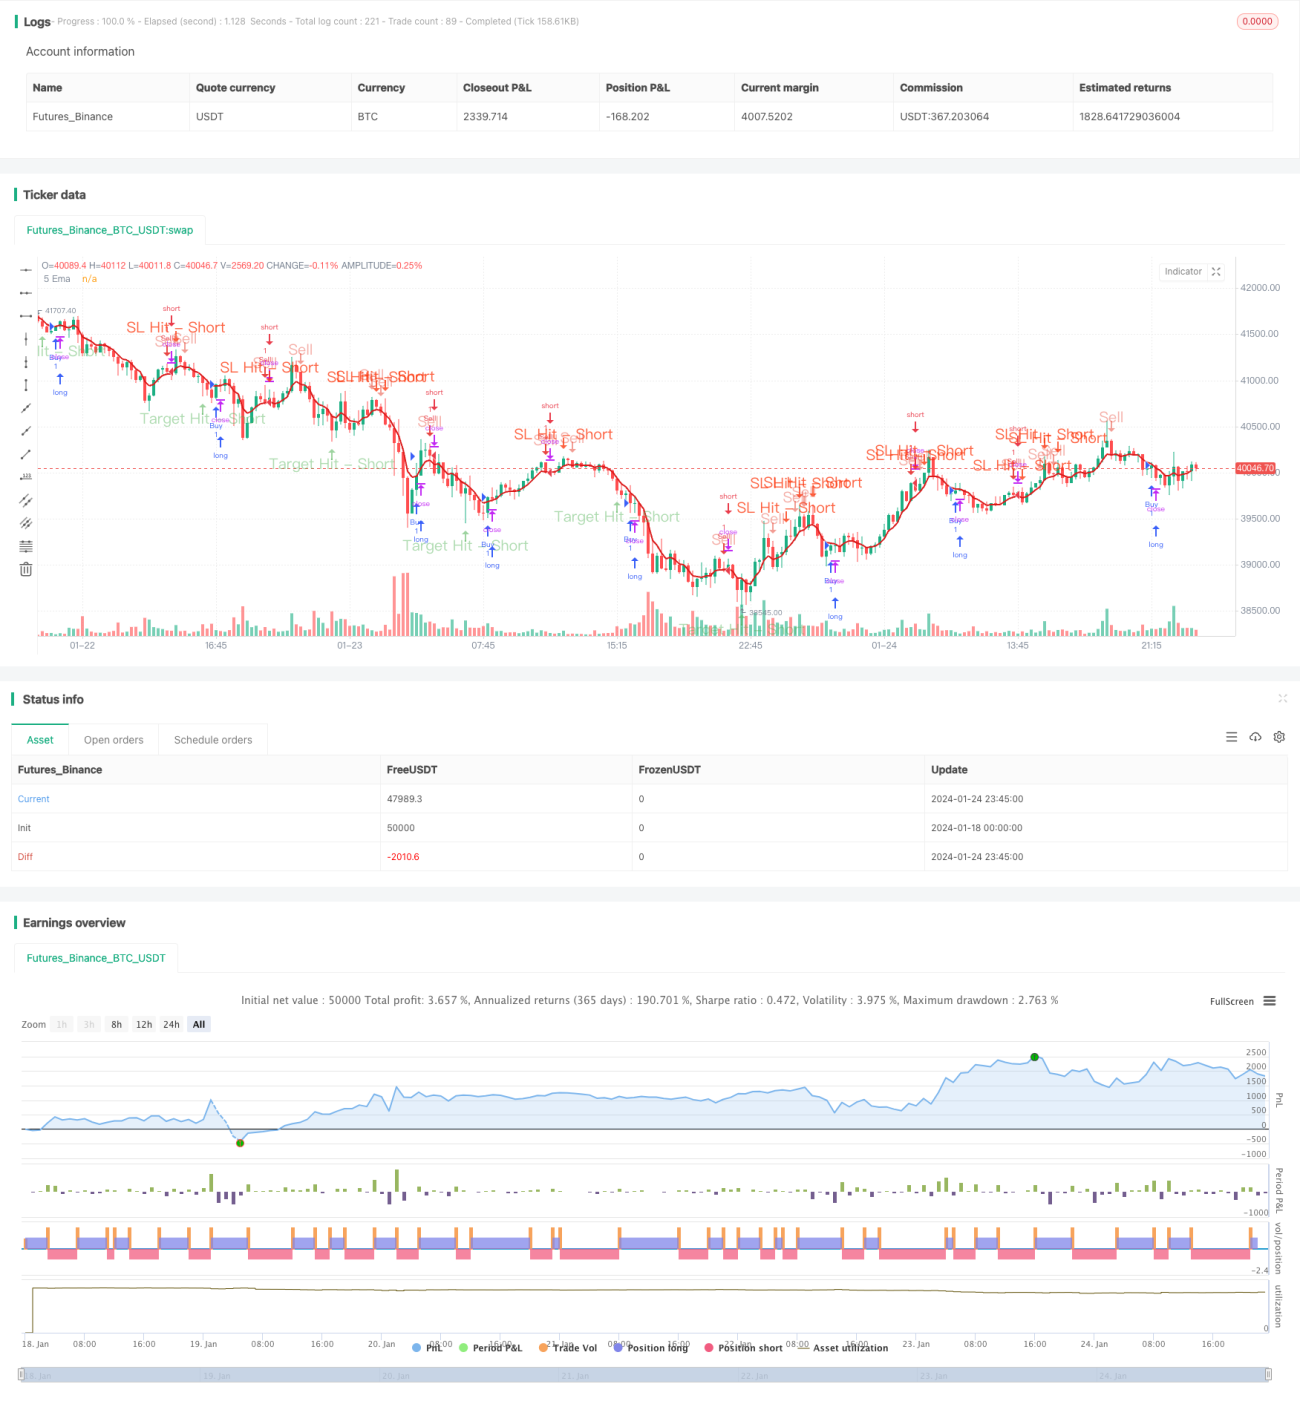
A lógica central da estratégia baseia-se em uma média móvel simples de 5 dias. Quando o preço deve ultrapassar essa média, um ponto mais alto ou mais baixo da linha K é formado, o que é um potencial sinal de alta ou baixa. Quando o preço ultrapassa a média, a segunda linha K é fechada.
Quando o preço se encerra acima da média de 5 dias, o preço mais alto da linha K do salto acima é o ponto de parada, o preço mais baixo menos um determinado intervalo de retorno multiplicado pela taxa de retorno de risco como alvo de parada. Quando o preço se encerra abaixo da média de 5 dias, o preço mais baixo da linha K do salto acima é o ponto de parada, o preço mais alto mais um determinado intervalo de retorno multiplicado pela taxa de retorno de risco como alvo de parada.
A estratégia também oferece uma condição de filtragem opcional, que é o preço de fechamento do atual K-line seja um pouco mais baixo ou um pouco mais alto em relação ao K-line de salto, para evitar o sinal parcialmente errado.
Pode-se reduzir o risco por meio de métodos como stop loss razoável, posse de flexibilidade apropriada e opção de negociação de baixa frequência. Pode-se considerar a filtragem de sinais em combinação com outros indicadores.
Esta estratégia é, em geral, uma estratégia de negociação de linha curta e média que é fácil de entender e implementar. Utiliza a média móvel e a linha de K para identificar os pontos de mudança de tendência e opera sob uma estrutura de controle de risco racional. Embora ainda haja espaço para melhorias, o seu pensamento central é universal e vale a pena ser aprendido e aplicado.
/*backtest
start: 2024-01-18 00:00:00
end: 2024-01-25 00:00:00
period: 15m
basePeriod: 5m
exchanges: [{"eid":"Futures_Binance","currency":"BTC_USDT"}]
*/
// This source code is subject to the terms of the Mozilla Public License 2.0 at https://mozilla.org/MPL/2.0/
// © TradingInsights2
//@version=5
strategy("Ultimate 5EMA Strategy By PowerOfStocks", overlay=true)
Eusl = input.bool(false, title="Enable the Extra SL shown below")
usl = input.int(defval=5, title='Value to set SL number of points below-low or above-high', minval=1, maxval=100)
RiRe = input.int(defval=3, title='Risk to Reward Ratio', minval=1, maxval=25)
ShowSell = input.bool(true, 'Show Sell Signals')
ShowBuy = input.bool(false, 'Show Buy Signals')
BSWCon = input.bool(defval=false, title='Buy/Sell with Extra Condition - candle close')
// Moving Average
ema5 = ta.ema(close, 5)
pema5 = plot(ema5, '5 Ema', color=color.new(#da1a1a, 0), linewidth=2)
var bool Short = na
var bool Long = na
var shortC = 0
var sslhitC = 0
var starhitC = 0
var float ssl = na
var float starl = na
var float star = na
var float sellat = na
var float alert_shorthigh = na
var float alert_shortlow = na
var line lssl = na
var line lstar = na
var line lsell = na
var label lssllbl = na
var label lstarlbl = na
var label lselllbl = na
var longC = 0
var lslhitC = 0
var ltarhitC = 0
var float lsl = na
var float ltarl = na
var float ltar = na
var float buyat = na
var float alert_longhigh = na
var float alert_longlow = na
var line llsl = na
var line lltar = na
var line lbuy = na
var label llsllbl = na
var label lltarlbl = na
var label lbuylbl = na
ShortWC = low[1] > ema5[1] and low[1] > low and shortC == 0 and close < close[1]
ShortWOC = low[1] > ema5[1] and low[1] > low and shortC == 0
Short := BSWCon ? ShortWC : ShortWOC
sslhit = high > ssl and shortC > 0 and sslhitC == 0
starhit = low < star and shortC > 0 and starhitC == 0
LongWC = high[1] < ema5[1] and high[1] < high and longC == 0 and close > close[1]
LongWOC = high[1] < ema5[1] and high[1] < high and longC == 0
Long := BSWCon ? LongWC : LongWOC
lslhit = low < lsl and longC > 0 and lslhitC == 0
ltarhit = high > ltar and longC > 0 and ltarhitC == 0
if Short and ShowSell
shortC := shortC + 1
sslhitC := 0
starhitC := 0
alert_shorthigh := high[1]
if Eusl
ssl := high[1] + usl
starl := BSWCon ? ((high[1] - close) + usl) * RiRe : ((high[1] - low[1]) + usl) * RiRe
else
ssl := high[1]
starl := BSWCon ? (high[1] - close) * RiRe : (high[1] - low[1]) * RiRe
star := BSWCon ? close - starl : low[1] - starl
sellat := BSWCon ? close : low[1]
// lssl := line.new(bar_index, ssl, bar_index, ssl, color=color.new(#fc2d01, 45), style=line.style_dashed)
// lstar := line.new(bar_index, star, bar_index, star, color=color.new(color.green, 45), style=line.style_dashed)
// lsell := line.new(bar_index, sellat, bar_index, sellat, color=color.new(color.orange, 45), style=line.style_dashed)
// lssllbl := label.new(bar_index, ssl, style=label.style_none, text='Stop Loss - Short' + ' (' + str.tostring(ssl) + ')', textcolor=color.new(#fc2d01, 35), color=color.new(#fc2d01, 35))
// lstarlbl := label.new(bar_index, star, style=label.style_none, text='Target - Short' + ' (' + str.tostring(star) + ')', textcolor=color.new(color.green, 35), color=color.new(color.green, 35))
// lselllbl := label.new(bar_index, sellat, style=label.style_none, text='Sell at' + ' (' + str.tostring(sellat) + ')', textcolor=color.new(color.orange, 35), color=color.new(color.orange, 35))
if sslhit == false and starhit == false and shortC > 0
// line.set_x2(lssl, bar_index)
// line.set_x2(lstar, bar_index)
// line.set_x2(lsell, bar_index)
sslhitC := 0
starhitC := 0
else
if sslhit
shortC := 0
sslhitC := sslhitC + 1
else
if starhit
shortC := 0
starhitC := starhitC + 1
if Long and ShowBuy
longC := longC + 1
lslhitC := 0
ltarhitC := 0
alert_longlow := low[1]
if Eusl
lsl := low[1] - usl
ltarl := BSWCon ? ((close - low[1]) + usl) * RiRe : ((high[1] - low[1]) + usl) * RiRe
else
lsl := low[1]
ltarl := BSWCon ? (close - low[1]) * RiRe : (high[1] - low[1]) * RiRe
ltar := BSWCon ? close + ltarl : high[1] + ltarl
buyat := BSWCon ? close : high[1]
llsl := line.new(bar_index, lsl, bar_index, lsl, color=color.new(#fc2d01, 45), style=line.style_dotted)
lltar := line.new(bar_index, ltar, bar_index, ltar, color=color.new(color.green, 45), style=line.style_dotted)
lbuy := line.new(bar_index, buyat, bar_index, buyat, color=color.new(color.orange, 45), style=line.style_dotted)
llsllbl := label.new(bar_index, lsl, style=label.style_none, text='Stop Loss - Long' + ' (' + str.tostring(lsl) + ')', textcolor=color.new(#fc2d01, 35), color=color.new(#fc2d01, 35))
lltarlbl := label.new(bar_index, ltar, style=label.style_none, text='Target - Long' + ' (' + str.tostring(ltar) + ')', textcolor=color.new(color.green, 35), color=color.new(color.green, 35))
lbuylbl := label.new(bar_index, buyat, style=label.style_none, text='Buy at' + ' (' + str.tostring(buyat) + ')', textcolor=color.new(color.orange, 35), color=color.new(color.orange, 35))
if lslhit == false and ltarhit == false and longC > 0
// line.set_x2(llsl, bar_index)
// line.set_x2(lltar, bar_index)
// line.set_x2(lbuy, bar_index)
lslhitC := 0
ltarhitC := 0
else
if lslhit
longC := 0
lslhitC := lslhitC + 1
else
if ltarhit
longC := 0
ltarhitC := ltarhitC + 1
strategy.entry("Buy", strategy.long, when=Long)
strategy.entry("Sell", strategy.short, when=Short)
strategy.close("ExitBuy", when=sslhit or starhit)
strategy.close("ExitSell", when=lslhit or ltarhit)
plotshape(ShowSell and Short, title='Sell', location=location.abovebar, offset=0, color=color.new(#e74c3c, 45), style=shape.arrowdown, size=size.normal, text='Sell', textcolor=color.new(#e74c3c, 55))
plotshape(ShowSell and sslhit, title='SL Hit - Short', location=location.abovebar, offset=0, color=color.new(#fc2d01, 25), style=shape.arrowdown, size=size.normal, text='SL Hit - Short', textcolor=color.new(#fc2d01, 25))
plotshape(ShowSell and starhit, title='Target Hit - Short', location=location.belowbar, offset=0, color=color.new(color.green, 45), style=shape.arrowup, size=size.normal, text='Target Hit - Short', textcolor=color.new(color.green, 55))
plotshape(ShowBuy and Long, title='Buy', location=location.belowbar, offset=0, color=color.new(#2ecc71, 45), style=shape.arrowup, size=size.normal, text='Buy', textcolor=color.new(#2ecc71, 55))
plotshape(ShowBuy and lslhit, title='SL Hit - Long', location=location.belowbar, offset=0, color=color.new(#fc2d01, 25), style=shape.arrowdown, size=size.normal, text='SL Hit - Long', textcolor=color.new(#fc2d01, 25))
plotshape(ShowBuy and ltarhit, title='Target Hit - Long', location=location.abovebar, offset=0, color=color.new(color.green, 45), style=shape.arrowup, size=size.normal, text='Target Hit - Long', textcolor=color.new(color.green, 55))
if ShowSell and Short
alert("Go Short@ " + str.tostring(sellat) + " : SL@ " + str.tostring(ssl) + " : Target@ " + str.tostring(star) + " ", alert.freq_once_per_bar )
if ShowBuy and Long
alert("Go Long@ " + str.tostring(buyat) + " : SL@ " + str.tostring(lsl) + " : Target@ " + str.tostring(ltar) + " ", alert.freq_once_per_bar )
///// End of code