Estratégia de negociação de reversão de força de momentum
Visão geral
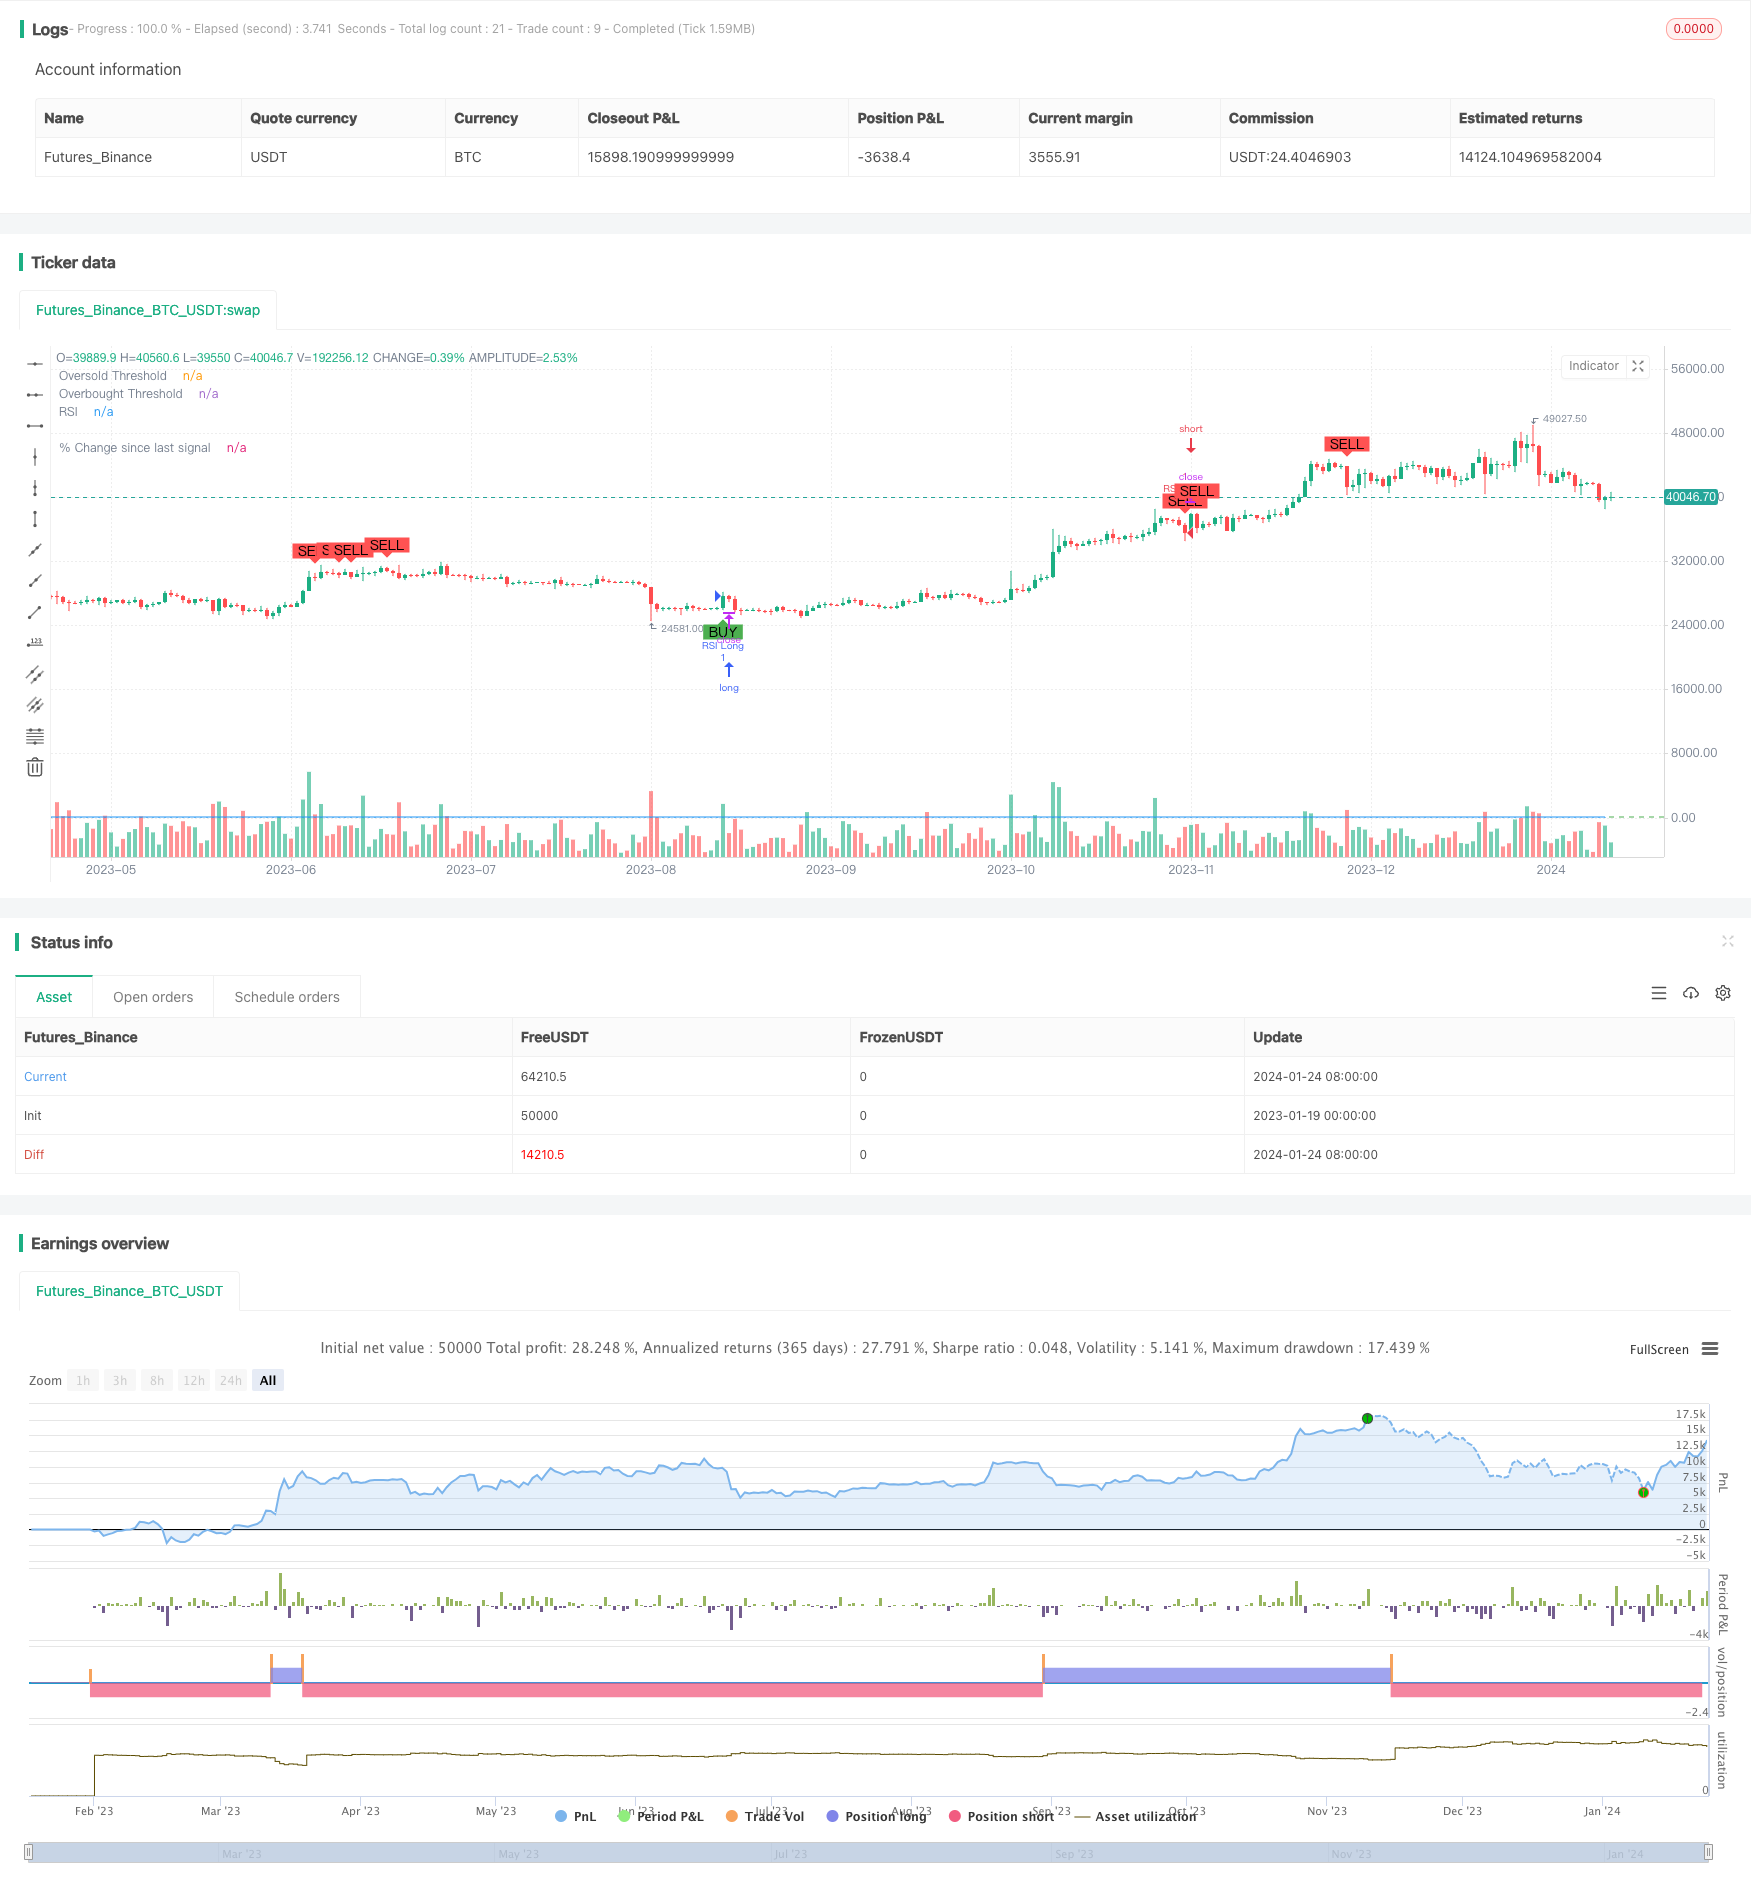
Esta estratégia identifica potenciais oportunidades de compra e venda no mercado através da computação do índice de força relativa (RSI). Utiliza o indicador RSI para determinar o ponto em que o preço pode mudar de tendência para uma contra-tendência para capturar oportunidades de reversão.
Princípio da estratégia
O indicador central da estratégia é o RSI, que mostra a proporção de dias em que os preços de fechamento aumentaram em relação ao número de dias em que os preços caíram durante um período de tempo, e é usado para determinar se um ativo está sobrevalorizado ou subvalorizado. O RSI é exibido em valores entre 0 e 100, com um valor alto indicando a força do mercado para cima e um valor baixo indicando a força do mercado para baixo.
A estratégia começa por definir os parâmetros do RSI, incluindo o comprimento do ciclo (default 14) e o limiar da zona de oversold (default 70 e 30). Em seguida, o valor do RSI é calculado de acordo com o preço de fechamento. Quando o RSI cruza o limiar da zona de oversold, gera um sinal de compra; quando o RSI cruza o limiar da zona de oversold, gera um sinal de venda.
A estratégia traça simultaneamente a curva do indicador RSI e a linha de queda. Os sinais de compra e venda são marcados em letras e gráficos no gráfico de preços. Além disso, a estratégia calcula e traça a porcentagem de mudança de preço desde o sinal de negociação anterior, permitindo que o comerciante veja o movimento de preços após o sinal.
Análise de vantagens
- A capacidade de o RSI determinar sobrecompra e sobrevenda para identificar oportunidades de reversão
- Combinação de sinais de negociação visuais para visualizar pontos de entrada
- Calcular e mostrar a variação percentual desde o sinal anterior para avaliar o efeito de uma reversão de tendência
- Os parâmetros RSI são configuráveis para diferentes períodos e para a negociação de diferentes ativos
- Pode ser usado sozinho ou em combinação com outros indicadores para melhorar a eficácia da estratégia
Análise de Riscos
- A possibilidade de que o RSI produza um falso sinal, sem realmente desencadear uma reversão
- A tendência de reversão não tem continuidade e pode ser um ajuste de curto prazo
- O RSI tem maior probabilidade de falhar em períodos de alta volatilidade
- Recomenda-se o uso de uma combinação de indicadores de quantidade e preço para garantir a confiabilidade dos sinais de negociação
- Áreas de depressão devem ser adequadamente ajustadas para reduzir falsos sinais
Direção de otimização
- Aumentar o mecanismo de suspensão de prejuízos para controlar as perdas individuais
- Indicadores como as médias móveis para evitar brechas falsas
- Teste do efeito dos parâmetros do RSI em diferentes períodos de comprimento
- Otimização da depreciação das áreas de sobrecompra e sobrevenda de acordo com a situação do mercado
- Adição de módulo de gerenciamento de posições para aumentar o crescimento do índice de lucro
Resumir
Esta estratégia foi concebida com base no princípio de negociação de inversão do índice de força relativa, principalmente para determinar se há um fenômeno de sobrecompra e sobrevenda de ativos visíveis no curto prazo, a fim de capturar oportunidades de inversão subsequentes. A variação percentual é calculada e acompanhada de dicas de negociação visuais para auxiliar na decisão de negociação. Os parâmetros RSI podem ser configurados de forma personalizada e os usuários podem ajustá-los de acordo com as preferências pessoais.
/*backtest
start: 2023-01-19 00:00:00
end: 2024-01-25 00:00:00
period: 1d
basePeriod: 1h
exchanges: [{"eid":"Futures_Binance","currency":"BTC_USDT"}]
*/

//@version=5
strategy("Improved RSI Strategy", overlay=true)

// Define RSI parameters
rsiLength = input(14, title="RSI Length")
rsiOversold = input(30, title="Oversold Threshold")
rsiOverbought = input(70, title="Overbought Threshold")

// Calculate RSI
rsiValue = ta.rsi(close, rsiLength)

// Define entry conditions
longCondition = ta.crossover(rsiValue, rsiOversold)
shortCondition = ta.crossunder(rsiValue, rsiOverbought)

// Plot RSI and thresholds
plot(rsiValue, title="RSI", color=color.blue)
hline(rsiOversold, title="Oversold Threshold", color=color.red)
hline(rsiOverbought, title="Overbought Threshold", color=color.green)

// Calculate percentage change since last signal
var float percentageChange = na
lastCloseValue = ta.valuewhen(longCondition or shortCondition, close, 1)

if longCondition or shortCondition
    percentageChange := (close - lastCloseValue) / lastCloseValue * 100

plot(percentageChange, color=color.blue, style=plot.style_histogram, linewidth=1, title="% Change since last signal")

// Execute strategy
if longCondition
    strategy.entry("RSI Long", strategy.long)

if shortCondition
    strategy.entry("RSI Short", strategy.short)

// Plot shapes and text for buy/sell signals
plotshape(series=longCondition, title="Buy Signal", location=location.belowbar, color=color.green, style=shape.labelup, text="BUY")
plotshape(series=shortCondition, title="Sell Signal", location=location.abovebar, color=color.red, style=shape.labeldown, text="SELL")