Estratégia de acompanhamento de tendência de rompimento do canal Donchian
Visão geral
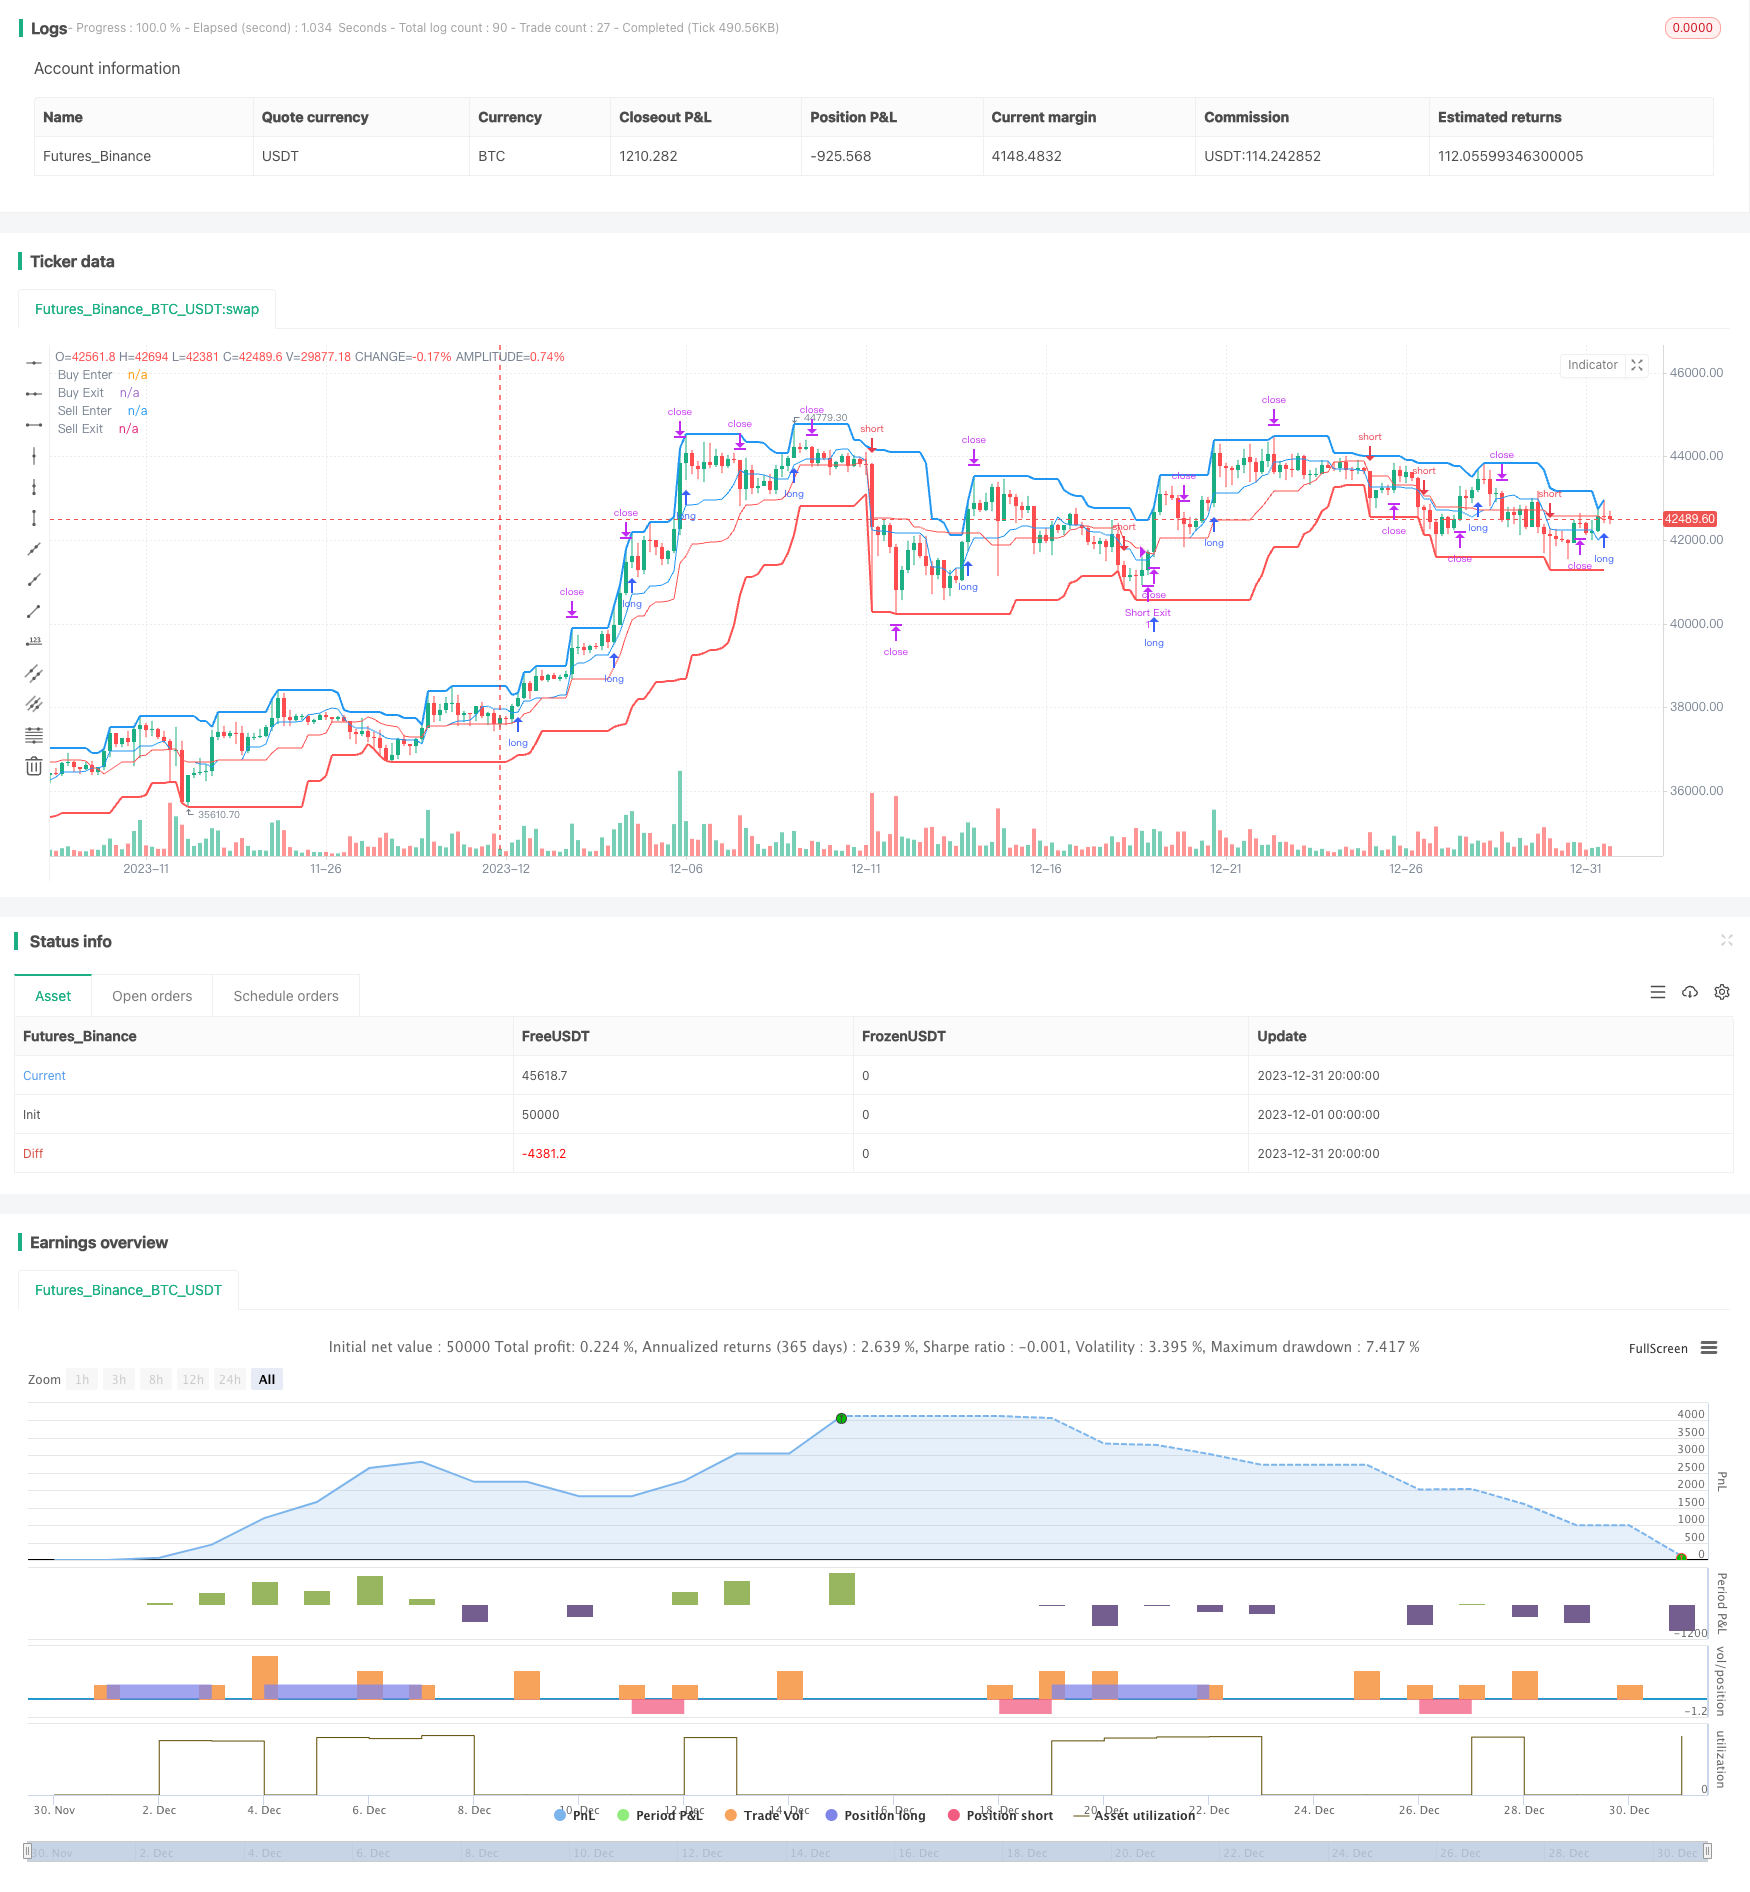
A estratégia de ruptura do canal de Dongxian é uma estratégia de acompanhamento de tendências que forma um canal de preços, calculando os preços mais altos e mais baixos em um determinado período de tempo, e usa os limites do canal como um sinal de compra e venda. Quando o preço se eleva, faça um curto; quando o preço se desmonta, faça mais.
Princípio da estratégia
A estratégia usa o indicador de corredores de tangjian para determinar a tendência dos preços e calcular os pontos de entrada e saída. Os corredores de tangjian são compostos por um traço superior, um traço inferior e um traço médio. O traço superior é o preço mais alto, o traço inferior é o preço mais baixo e o traço médio é o preço médio em um determinado período.
O comprimento do ciclo de entrada e saída pode ser configurado de forma independente. Quando o preço se move para cima, faz-se mais entrada; quando o preço se move para baixo, faz-se entrada em branco. O ponto de saída é o preço que toca novamente a correspondente órbita.
Além disso, a estratégia também configura um ponto de parada. O preço de parada de mais posições é o preço de entrada ((1 + proporção de parada de parada), enquanto a posição em aberto é o oposto. Ativar esse recurso pode bloquear os lucros e evitar a expansão dos perdas.
Em geral, a estratégia julga a tendência e, ao mesmo tempo, assegura que haja espaço suficiente para a configuração de stop-loss e stop-loss. Isso o torna especialmente adequado para variedades com alta volatilidade, como moedas digitais.
Análise de vantagens
A estratégia tem as seguintes vantagens:
- A estratégia é clara, a geração de sinais é simples e confiável.
- O indicador de Tangxian Channel é insensível às oscilações de preços e é útil para capturar tendências.
- Parâmetros de canal personalizáveis para diferentes variedades e períodos de tempo.
- Função de bloqueio de danos integrada para controlar o risco.
- A taxa de câmbio é a taxa de câmbio mais alta do mundo, com uma taxa de câmbio mais alta do que a taxa de câmbio do mundo.
Análise de Riscos
A estratégia também apresenta os seguintes riscos:
- O que é que os bancos têm de melhor para evitar os riscos de grandes perdas?
- A configuração inadequada dos parâmetros pode levar a transações excessivamente frequentes, aumentando os custos de transação e o risco de deslizamento.
- A estratégia é insensível à oscilação dos preços e pode perder algumas oportunidades de negociação.
Para controlar esses riscos, recomenda-se:
- Reduzir adequadamente o investimento individual, diversificar as variedades de investimento e controlar o risco geral.
- Optimizar os parâmetros, procurar a melhor combinação de parâmetros. Pode-se tentar a otimização automática com métodos como aprendizado de máquina.
- Combinado com indicadores adicionais para avaliar a confiabilidade dos sinais de ruptura, evita transações erradas.
Direção de otimização
A estratégia pode ser melhorada em:
- Teste e otimize mais combinações de parâmetros para encontrar o melhor. Os principais parâmetros incluem o ciclo de passagem, a proporção de parada, se é permitido fazer mais vazio, etc.
- Adicionar modelos de aprendizagem de máquina para identificar automaticamente os parâmetros ótimos. Pode-se adotar métodos como aprendizagem por reforço.
- Combinação de outros indicadores para determinar a tendência e a confiabilidade do sinal, como linha média, volume de transação, etc.
- Desenvolver estratégias de stop loss, como o rastreamento de stop loss, Chandelier Exit, etc., para controlar ainda mais o risco.
- A expansão para mais variedades, procurando as variedades comercializadas que melhor se encaixam na estratégia.
Resumir
A estratégia de ruptura do Canal de Tōkyō é, em geral, uma estratégia de acompanhamento de tendências com clareza de julgamento e controle de risco. É especialmente adequada para variedades de alta volatilidade, como moedas digitais, com alto potencial de receita.
/*backtest
start: 2023-12-01 00:00:00
end: 2023-12-31 23:59:59
period: 4h
basePeriod: 15m
exchanges: [{"eid":"Futures_Binance","currency":"BTC_USDT"}]
*/

// This source code is subject to the terms of the Mozilla Public License 2.0 at https://mozilla.org/MPL/2.0/
// © algotradingcc
// Strategy testing and optimisation for free trading bot

//@version=4
strategy("Donchian Channel Strategy [for free bot]", overlay=true )

//Long optopns
buyPeriodEnter = input(10, "Channel Period for Long enter position")
buyPeriodExit = input(10, "Channel Period for Long exit position")
isMiddleBuy = input(true, "Is exit on Base Line? If 'no' - exit on bottom line")
takeProfitBuy = input(2.5, "Take Profit (%) for Long position")
isBuy = input(true, "Allow Long?")

//Short Options
sellPeriodEnter = input(20, "Channel Period for Short enter position")
sellPeriodExit = input(20, "Channel Period for Short exit position")
isMiddleSell = input(true, "Is exit on Base Line? If 'no' - exit on upper line")
takeProfitSell = input(2.5, "Take Profit (%) for Short position")
isSell = input(true, "Allow Short?")

// Test Start
startYear = input(2005, "Test Start Year")
startMonth = input(1, "Test Start Month")
startDay = input(1, "Test Start Day")
startTest = timestamp(startYear,startMonth,startDay,0,0)

//Test End
endYear = input(2050, "Test End Year")
endMonth = input(12, "Test End Month")
endDay = input(30, "Test End Day")
endTest = timestamp(endYear,endMonth,endDay,23,59)

timeRange = time > startTest and time < endTest ? true : false

// Long&Short Levels
BuyEnter = highest(buyPeriodEnter)
BuyExit = isMiddleBuy ? ((highest(buyPeriodExit) + lowest(buyPeriodExit)) / 2): lowest(buyPeriodExit)

SellEnter = lowest(sellPeriodEnter)
SellExit = isMiddleSell ? ((highest(sellPeriodExit) + lowest(sellPeriodExit)) / 2): highest(sellPeriodExit)

// Plot Data
plot(BuyEnter, style=plot.style_line, linewidth=2, color=color.blue, title="Buy Enter")
plot(BuyExit, style=plot.style_line, linewidth=1, color=color.blue, title="Buy Exit", transp=50)
plot(SellEnter, style=plot.style_line, linewidth=2, color=color.red, title="Sell Enter")
plot(SellExit, style=plot.style_line, linewidth=1, color=color.red, title="Sell Exit", transp=50)

// Calc Take Profits
TakeProfitBuy = 0.0
TakeProfitSell = 0.0
if strategy.position_size > 0
    TakeProfitBuy := strategy.position_avg_price*(1 + takeProfitBuy/100)

if strategy.position_size < 0
    TakeProfitSell := strategy.position_avg_price*(1 - takeProfitSell/100)

// Long Position
if isBuy and timeRange
    strategy.entry("Long", strategy.long, stop = BuyEnter, when = strategy.position_size == 0)

strategy.exit("Long Exit", "Long", stop=BuyExit, limit = TakeProfitBuy, when = strategy.position_size > 0)

// Short Position
if isSell and timeRange
    strategy.entry("Short", strategy.short, stop = SellEnter, when = strategy.position_size == 0)

strategy.exit("Short Exit", "Short", stop=SellExit, limit = TakeProfitSell, when = strategy.position_size < 0)

// Close & Cancel when over End of the Test
if time > endTest
    strategy.close_all()
    strategy.cancel_all()