Estratégia de negociação quantitativa de média móvel dupla
Visão geral
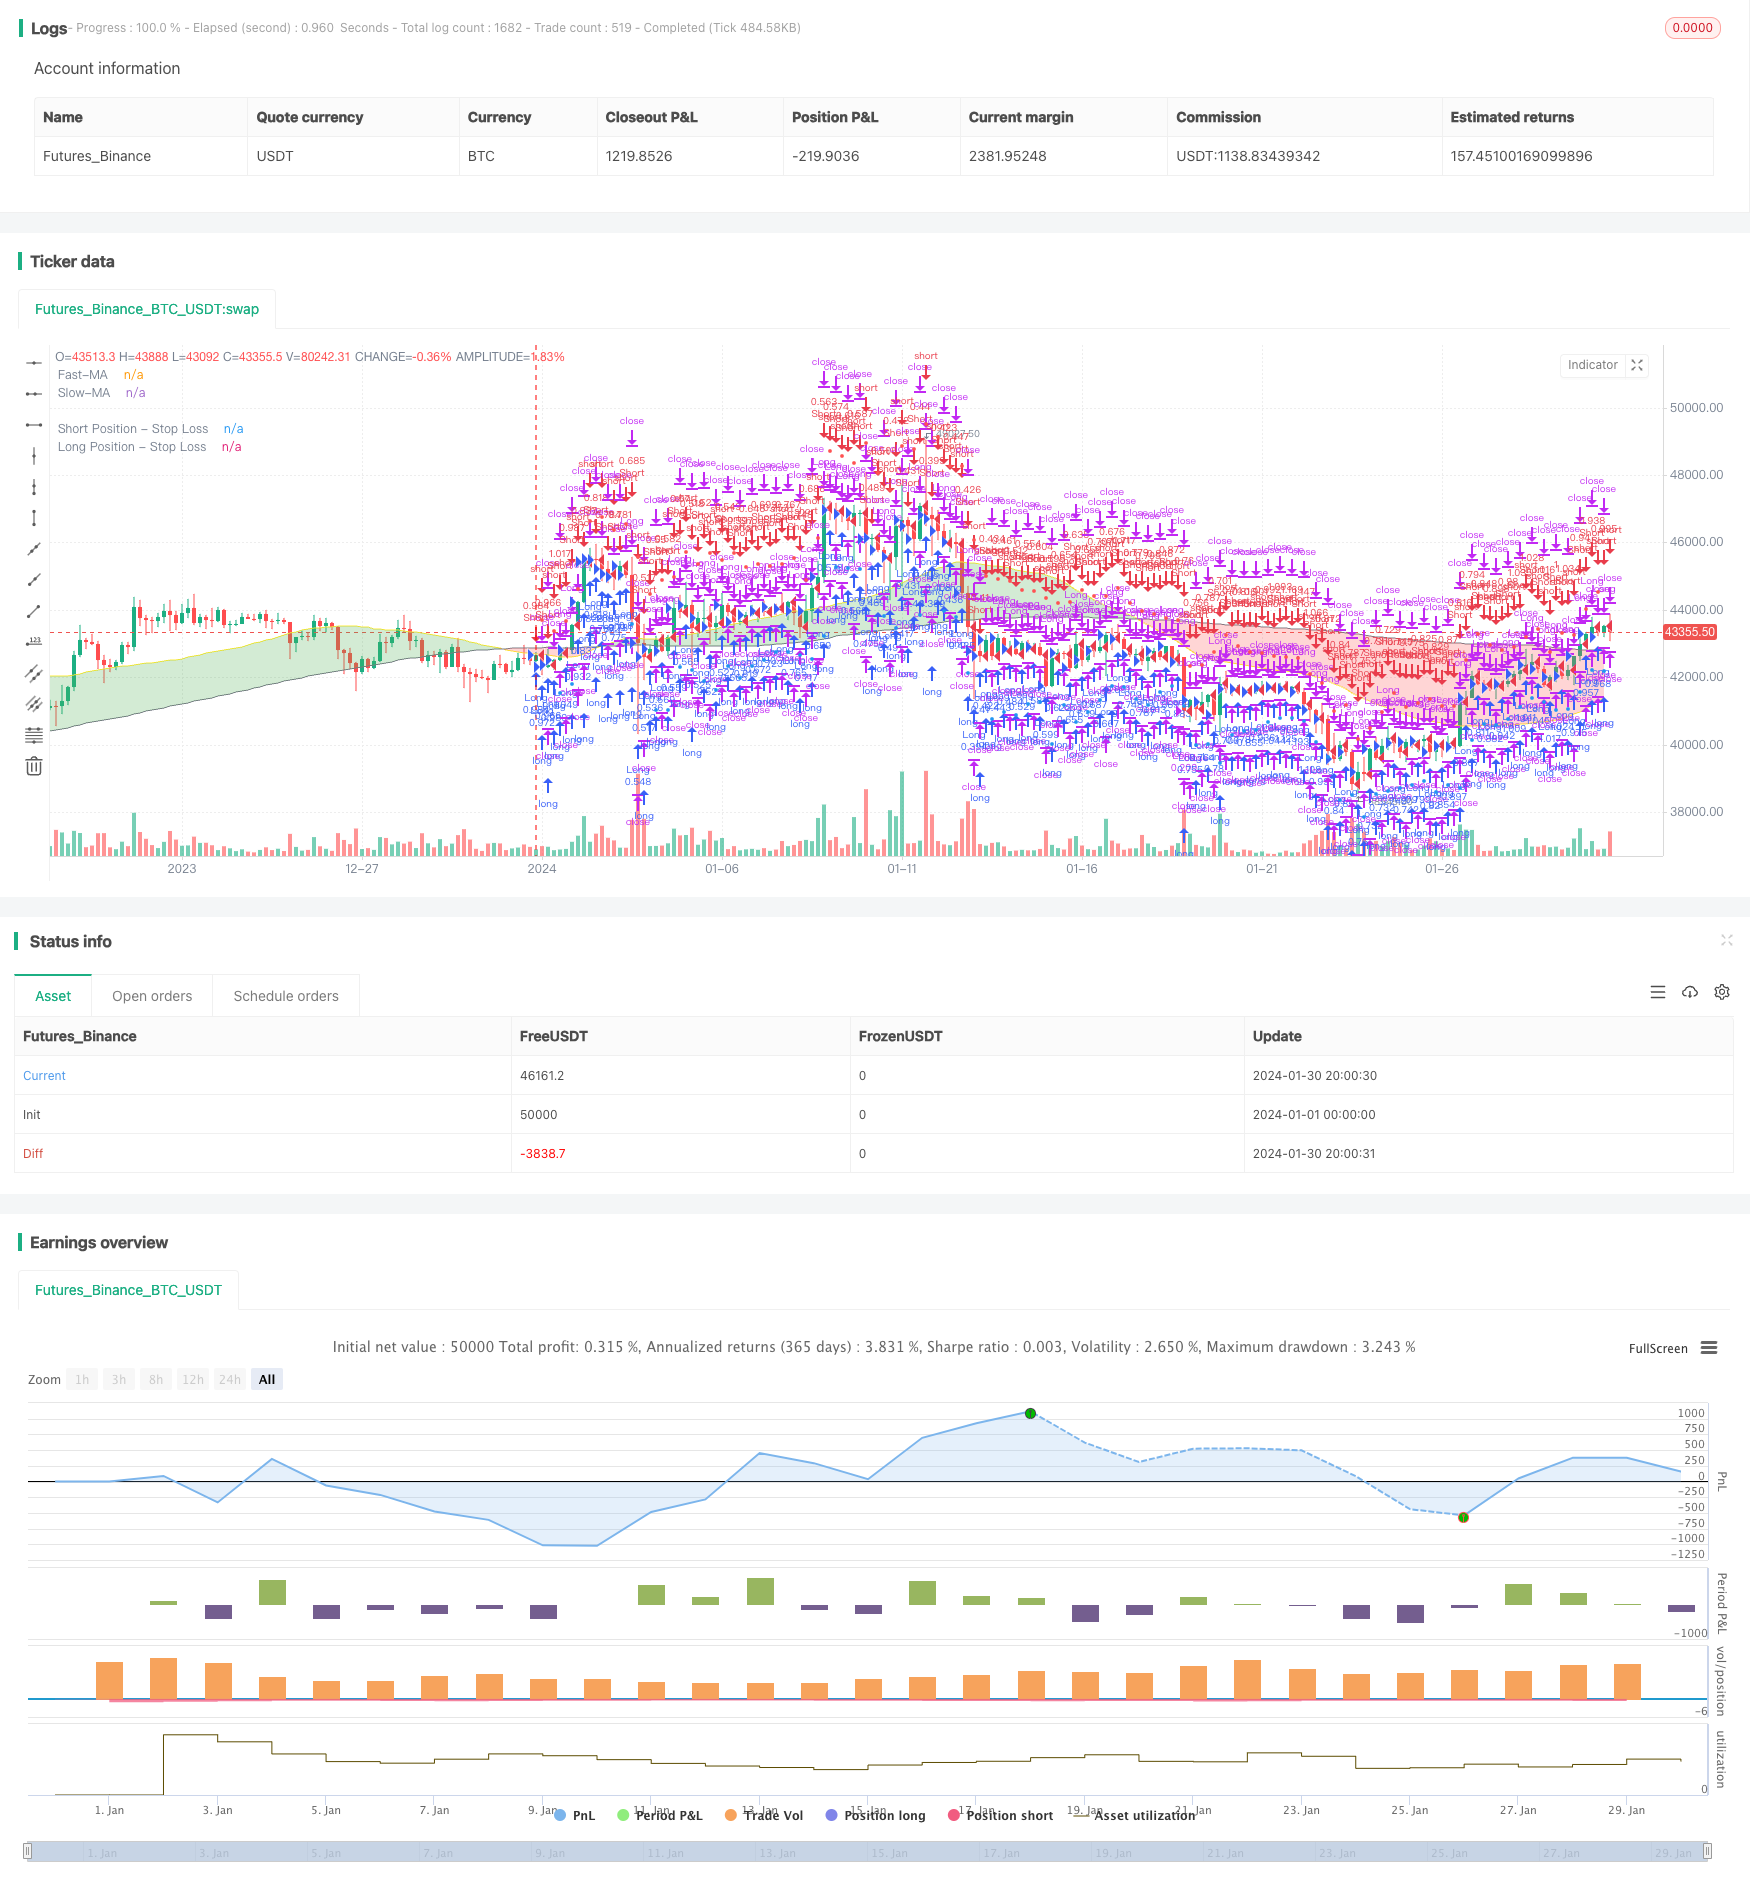
Esta estratégia é um tipo de estratégia de acompanhamento de tendências, calculada através de médias móveis rápidas e médias móveis lentas, e combinada com indicadores de paralelo. Faça mais quando atravessa a média móvel lenta acima da média móvel rápida; faça zero quando atravessa a média móvel lenta abaixo da média móvel rápida.
Princípio da estratégia
- Calcule a média móvel rápida e a média móvel lenta. Os parâmetros da média móvel podem ser personalizados.
- Comparando duas médias móveis, julgue a direção da tendência do mercado. Quando a média móvel rápida atravessa a média móvel lenta, julgue-a como um mercado multi-cabeça; Quando a média móvel rápida atravessa a média móvel lenta abaixo, julgue-a como um mercado vazio.
- Combinando a relação entre o preço de fechamento e a média móvel como confirmação adicional. Um sinal de compra só é gerado quando a linha rápida atravessa a linha lenta e o preço de fechamento é maior do que a linha rápida; um sinal de venda só é gerado quando a linha rápida atravessa a linha lenta abaixo e o preço de fechamento é menor do que a linha rápida.
- O uso de indicadores de linha de paralelo para filtrar brechas falsas. Somente quando a linha rápida atravessa a linha lenta, e o preço de fechamento está acima da linha rápida, e o preço da ação está acima da linha de paralelo, o sinal de compra é finalmente produzido; e vice-versa.
- Estabelecer uma linha de stop loss com base no máximo de perdas suportadas. Calcular o preço de stop loss específico em combinação com o indicador ATR
Vantagens estratégicas
- Utilize as médias móveis para determinar a direção da tendência do mercado e evite a frequência de negociações em mercados de liquidação sem uma direção clara
- Condições de dupla filtragem evitam problemas comuns de falsas brechas
- Combinação de estratégias de stop-loss para controlar efetivamente as perdas individuais
Risco estratégico
- Estratégias de indicadores são propensas a produzir falsos sinais
- Risco monetário não considerado
- O que pode ter sido perdido no início
Para responder a estas questões, pode-se optimizar a partir dos seguintes aspectos:
- Parâmetros de média móvel otimizados para variedades específicas
- Filtragem de sinais em combinação com outros indicadores ou modelos
- Considere os riscos monetários de uma cobertura em tempo real ou de uma conta de corretor de conversão automática
Direção de otimização
- Optimizar os parâmetros da média móvel para capturar melhor as tendências
- Aumentar o portfólio de modelos para melhorar a precisão do sinal
- Verificação com múltiplos ciclos de tempo para evitar armadilhas
- Optimizar a estratégia de parada de perdas e aumentar a estabilidade da estratégia
Resumir
Esta estratégia pertence a uma típica estratégia de acompanhamento de tendências de duplas médias móveis e combinações de indicadores. Julga a tendência do mercado comparando a direção de duas médias móveis mais rápidas e mais lentas; e, em combinação com vários indicadores de filtragem, evita falsos sinais, gerando sinais de negociação. Ao mesmo tempo, a estratégia possui uma função de stop loss para controlar perdas individuais.
/*backtest
start: 2024-01-01 00:00:00
end: 2024-01-31 00:00:00
period: 4h
basePeriod: 15m
exchanges: [{"eid":"Futures_Binance","currency":"BTC_USDT"}]
*/

// This source code is subject to the terms of the Mozilla Public License 2.0 at https://mozilla.org/MPL/2.0/
// © sosacur01

//@version=5
strategy(title="2 MA | Trend Following", overlay=true, pyramiding=1, commission_type=strategy.commission.percent, commission_value=0.2, initial_capital=10000)

//==========================================


//BACKTEST RANGE
useDateFilter = input.bool(true, title="Filter Date Range of Backtest",
     group="Backtest Time Period")
backtestStartDate = input(timestamp("1 jan 2000"),
     title="Start Date", group="Backtest Time Period",
     tooltip="This start date is in the time zone of the exchange " +
     "where the chart's instrument trades. It doesn't use the time " +
     "zone of the chart or of your computer.")
backtestEndDate = input(timestamp("1 Jul 2100"),
     title="End Date", group="Backtest Time Period",
     tooltip="This end date is in the time zone of the exchange " +
     "where the chart's instrument trades. It doesn't use the time " +
     "zone of the chart or of your computer.")
inTradeWindow = true
if not inTradeWindow and inTradeWindow[1]
    strategy.cancel_all()
    strategy.close_all(comment="Date Range Exit")

//--------------------------------------

//LONG/SHORT POSITION ON/OFF INPUT
LongPositions   = input.bool(title='On/Off Long Postion', defval=true, group="Long & Short Position")
ShortPositions  = input.bool(title='On/Off Short Postion', defval=true, group="Long & Short Position")

//---------------------------------------

//SLOW MA INPUTS
averageType1   = input.string(defval="SMA", group="Slow MA Inputs", title="Slow MA Type", options=["SMA", "EMA", "WMA", "HMA", "RMA", "SWMA", "ALMA", "VWMA", "VWAP"])
averageLength1 = input.int(defval=160, group="Slow MA Inputs", title="Slow MA Length", minval=50)
averageSource1 = input(close, title="Slow MA Source", group="Slow MA Inputs")


//SLOW MA TYPE
MovAvgType1(averageType1, averageSource1, averageLength1) =>
	switch str.upper(averageType1)
        "SMA"  => ta.sma(averageSource1, averageLength1)
        "EMA"  => ta.ema(averageSource1, averageLength1)
        "WMA"  => ta.wma(averageSource1, averageLength1)
        "HMA"  => ta.hma(averageSource1, averageLength1)
        "RMA"  => ta.rma(averageSource1, averageLength1)
        "SWMA" => ta.swma(averageSource1)
        "ALMA" => ta.alma(averageSource1, averageLength1, 0.85, 6)
        "VWMA" => ta.vwma(averageSource1, averageLength1)
        "VWAP" => ta.vwap(averageSource1)
        => runtime.error("Moving average type '" + averageType1 +
             "' not found!"), na


//----------------------------------

//FAST MA INPUTS
averageType2   = input.string(defval="SMA", group="Fast MA Inputs", title="Fast MA Type", options=["SMA","EMA","WMA","HMA","RMA","SWMA","ALMA","VWMA","VWAP"])
averageLength2 = input.int(defval=40, group="Fast MA Inputs", title="Fast MA Length", maxval=40)
averageSource2 = input(close, title="Fast MA Source", group="Fast MA Inputs")

//FAST MA TYPE
MovAvgType2(averageType2, averageSource2, averageLength2) =>
	switch str.upper(averageType2)
        "SMA"  => ta.sma(averageSource2, averageLength2)
        "EMA"  => ta.ema(averageSource2, averageLength2)
        "WMA"  => ta.wma(averageSource2, averageLength2)
        "HMA"  => ta.hma(averageSource2, averageLength2)
        "RMA"  => ta.rma(averageSource2, averageLength2)
        "SWMA" => ta.swma(averageSource2)
        "ALMA" => ta.alma(averageSource2, averageLength2, 0.85, 6)
        "VWMA" => ta.vwma(averageSource2, averageLength2)
        "VWAP" => ta.vwap(averageSource2)
        => runtime.error("Moving average type '" + averageType2 +
             "' not found!"), na

//---------------------------------------------------

//MA VALUES
FASTMA = MovAvgType2(averageType2, averageSource2, averageLength2)
SLOWMA = MovAvgType1(averageType1, averageSource1, averageLength1)

//BUY/SELL TRIGGERS
bullish_trend = FASTMA > SLOWMA and close > FASTMA
bearish_trend = FASTMA < SLOWMA and close < FASTMA

//MAs PLOT
plot1 = plot(SLOWMA,color=color.gray, linewidth=1, title="Slow-MA")
plot2 = plot(FASTMA,color=color.yellow, linewidth=1, title="Fast-MA")
fill(plot1, plot2, color=SLOWMA>FASTMA ? color.new(color.red, 70) : color.new(color.green, 70), title="EMA Clouds")

//-----------------------------------------------------

//PARABOLIC SAR USER INPUT
usepsarFilter = input.bool(title='Use Parabolic Sar?', defval=true, group = "Parabolic SAR Inputs")
psar_display  = input.bool(title="Display Parabolic Sar?", defval=false, group="Parabolic SAR Inputs")
start         = input.float(title="Start", defval=0.02, group="Parabolic SAR Inputs", step=0.001)
increment     = input.float(title="Increment", defval=0.02, group="Parabolic SAR Inputs", step=0.001)
maximum       = input.float(title="Maximum", defval=0.2, group="Parabolic SAR Inputs", step=0.001)

//SAR VALUES
psar        = request.security(syminfo.tickerid, "D", ta.sar(start, increment, maximum))

//BULLISH & BEARISH PSAR CONDITIONS
bullish_psar = (usepsarFilter ? low > psar : bullish_trend )
bearsish_psar = (usepsarFilter ? high < psar : bearish_trend)

//SAR PLOT
psar_plot    = if low > psar
    color.rgb(198, 234, 199, 13)
else
    color.rgb(219, 134, 134, 48)

plot(psar_display ? psar : na, color=psar_plot, title="Par SAR")

//-------------------------------------

//ENTRIES AND EXITS
long_entry  = if inTradeWindow and bullish_trend  and bullish_psar and LongPositions
    true
long_exit   = if inTradeWindow and bearish_trend
    true

short_entry = if inTradeWindow  and bearish_trend and bearsish_psar and ShortPositions
    true
short_exit  = if inTradeWindow  and bullish_trend
    true

//--------------------------------------

//RISK MANAGEMENT - SL, MONEY AT RISK, POSITION SIZING
atrPeriod                = input.int(14, "ATR Length", group="Risk Management Inputs")
sl_atr_multiplier        = input.float(title="Long Position - Stop Loss - ATR Multiplier", defval=2, group="Risk Management Inputs", step=0.5)
sl_atr_multiplier_short  = input.float(title="Short Position - Stop Loss - ATR Multiplier", defval=2, group="Risk Management Inputs", step=0.5)
i_pctStop                = input.float(2, title="% of Equity at Risk", step=.5, group="Risk Management Inputs")/100

//ATR VALUE
_atr = ta.atr(atrPeriod)

//CALCULATE LAST ENTRY PRICE
lastEntryPrice = strategy.opentrades.entry_price(strategy.opentrades - 1)

//STOP LOSS - LONG POSITIONS
var float sl = na

//CALCULTE SL WITH ATR AT ENTRY PRICE - LONG POSITION
if (strategy.position_size[1] != strategy.position_size)
    sl := lastEntryPrice - (_atr * sl_atr_multiplier)

//IN TRADE - LONG POSITIONS
inTrade = strategy.position_size > 0

//PLOT SL - LONG POSITIONS
plot(inTrade ? sl : na, color=color.blue, style=plot.style_circles, title="Long Position - Stop Loss")

//CALCULATE ORDER SIZE - LONG POSITIONS
positionSize = (strategy.equity * i_pctStop) / (_atr * sl_atr_multiplier)

//============================================================================================

//STOP LOSS - SHORT POSITIONS
var float sl_short = na

//CALCULTE SL WITH ATR AT ENTRY PRICE - SHORT POSITIONS
if (strategy.position_size[1] != strategy.position_size)
    sl_short := lastEntryPrice + (_atr * sl_atr_multiplier_short)

//IN TRADE SHORT POSITIONS
inTrade_short = strategy.position_size < 0

//PLOT SL - SHORT POSITIONS
plot(inTrade_short ? sl_short : na, color=color.red, style=plot.style_circles, title="Short Position - Stop Loss")

//CALCULATE ORDER - SHORT POSITIONS
positionSize_short = (strategy.equity * i_pctStop) / (_atr * sl_atr_multiplier_short)


//===============================================

//LONG STRATEGY
strategy.entry("Long", strategy.long, comment="Long", when = long_entry, qty=positionSize)
if (strategy.position_size > 0)
    strategy.close("Long", when = (long_exit), comment="Close Long")
    strategy.exit("Long", stop = sl, comment="Exit Long")

//SHORT STRATEGY
strategy.entry("Short", strategy.short, comment="Short", when = short_entry, qty=positionSize_short)
if (strategy.position_size < 0)
    strategy.close("Short", when = (short_exit), comment="Close Short")
    strategy.exit("Short", stop = sl_short, comment="Exit Short")

//ONE DIRECTION TRADING COMMAND (BELLOW ONLY ACTIVATE TO CORRECT BUGS)