Estratégia de convergência de direção de momentum de negociação quantitativa
Visão geral
Esta estratégia, chamada de estratégia de convergência de direção de dinâmica de negociação de quantificação, é uma estratégia de negociação quantitativa projetada com base nos indicadores técnicos descritos por William Blau em seu livro Momentum, Direction and Divergence. A estratégia foca nos três níveis-chave de dinâmica, direção e convergência, para determinar a direção da tendência do mercado, calculando indicadores de dinâmica de preços de ações e procurando desvios entre preços e indicadores para obter oportunidades de negociação.
Princípio da estratégia
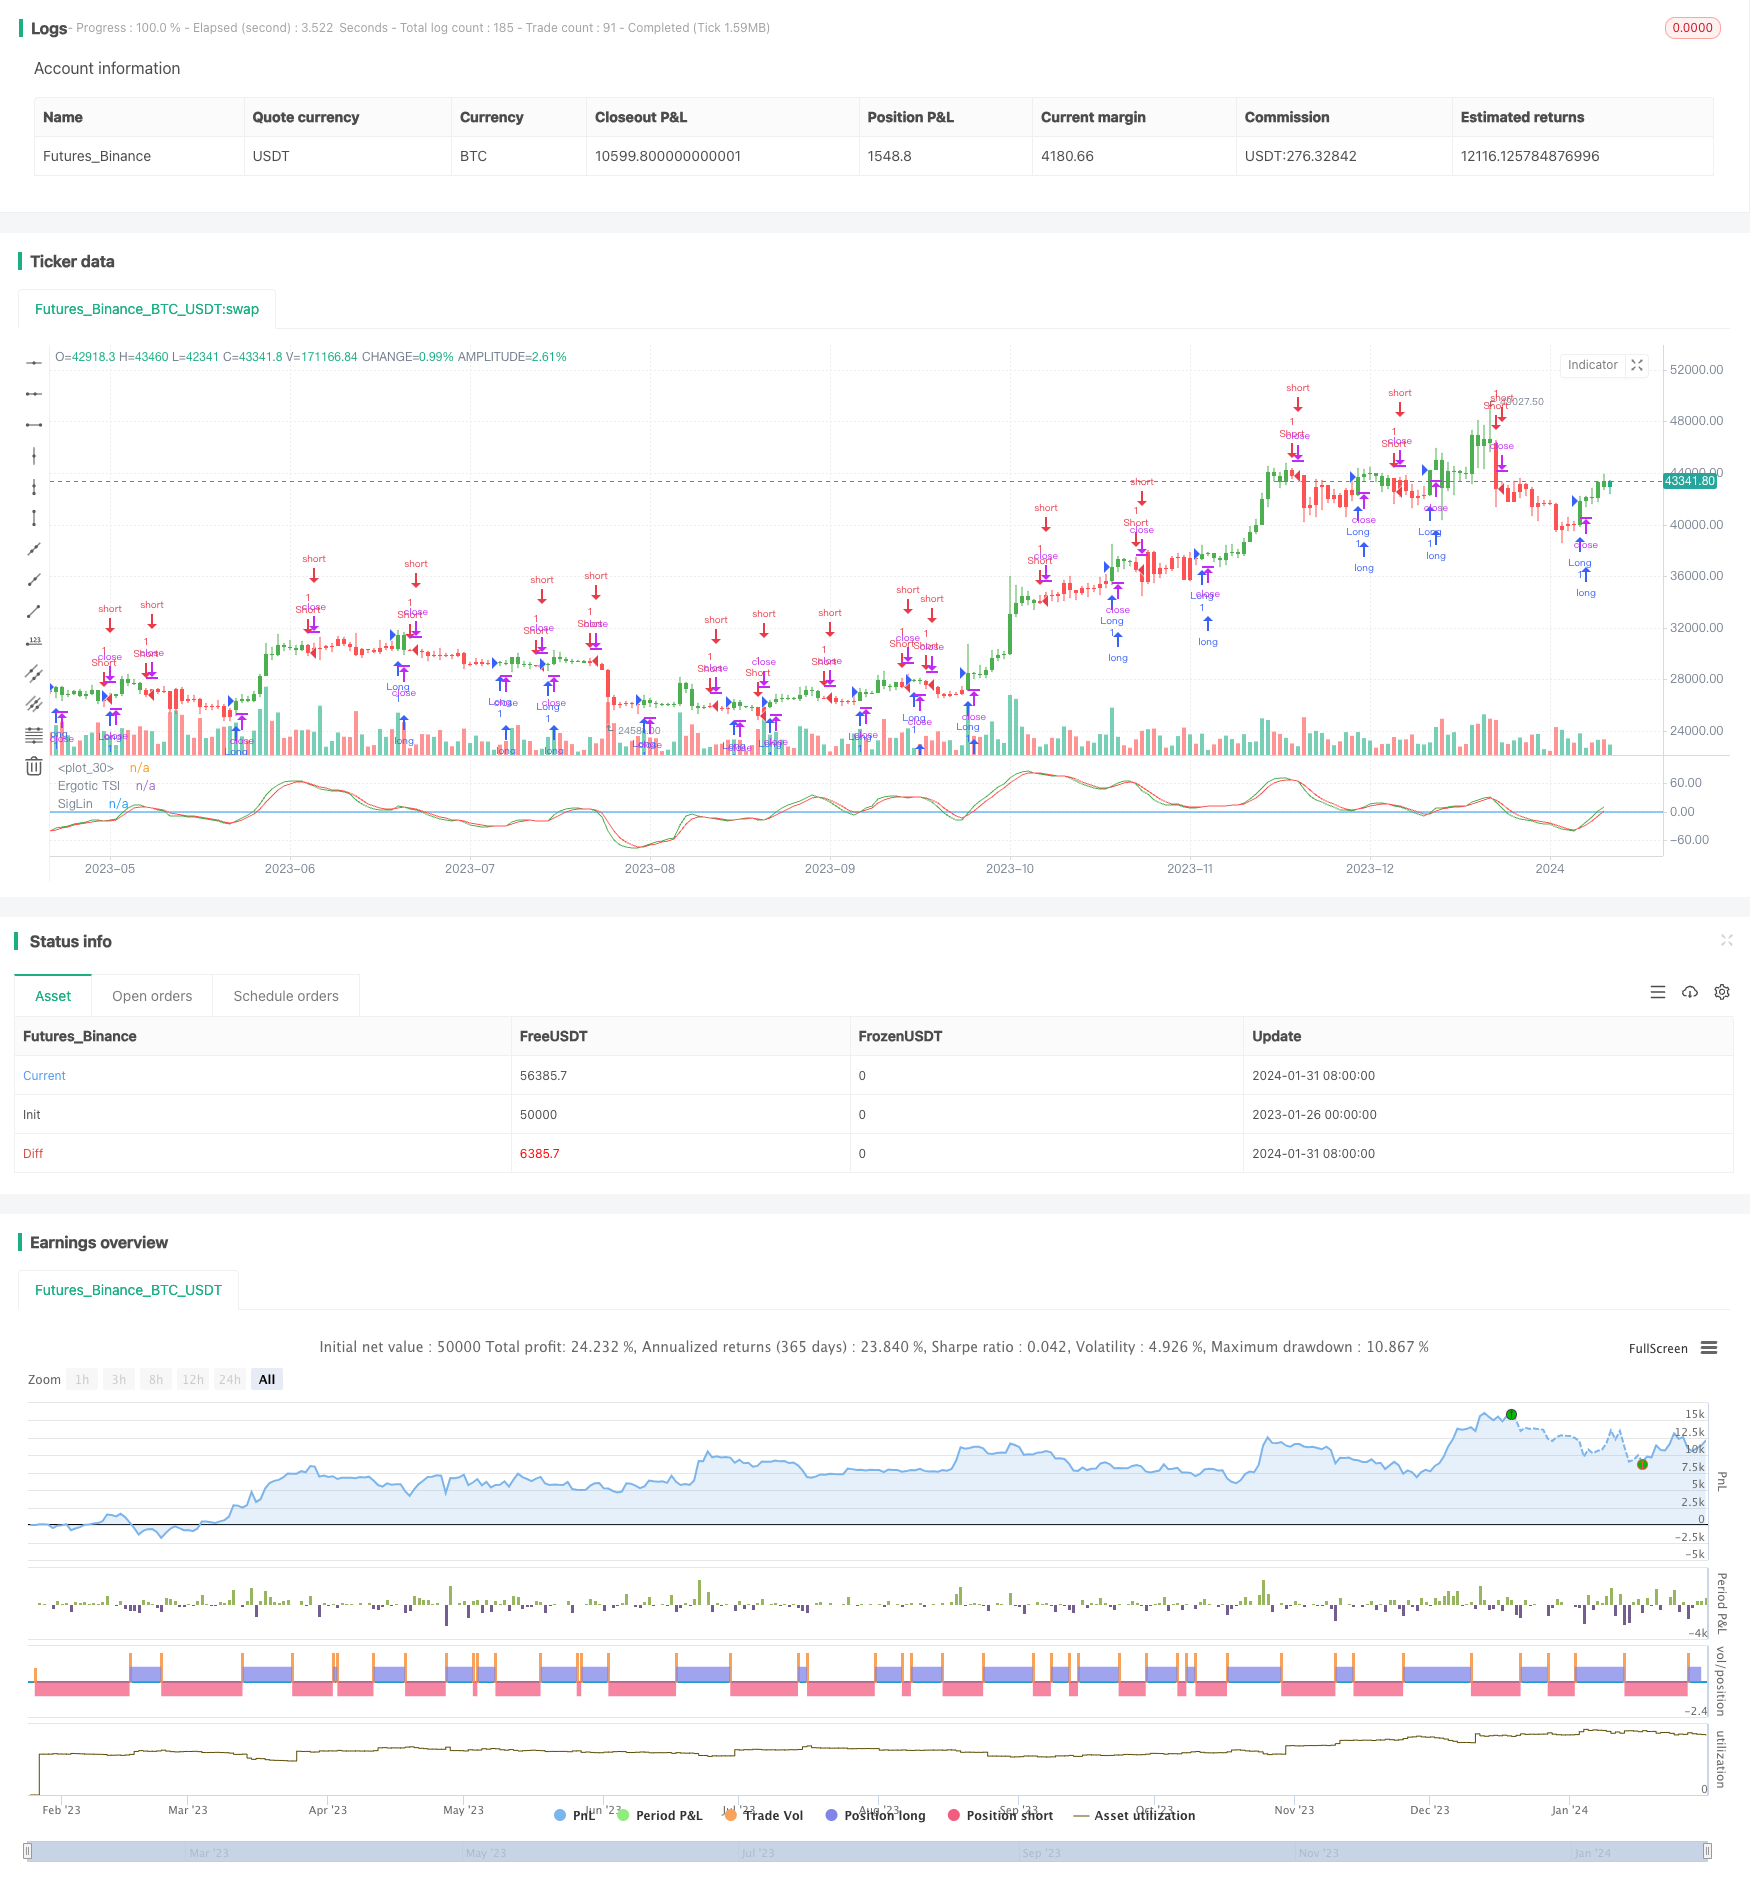
O indicador central desta estratégia é o Índice de Mobilidade de Emergência (Emergency Mobility Index - ERGOTIC TSI), cuja fórmula é a seguinte:
Val1 = 100 * EMA(EMA(EMA(价格变化量,r),s),u)

Val2 = EMA(EMA(EMA(价格变化量的绝对值,r),s),u)

Ergotic TSI = 如果Val2不等于0,则为Val1/Val2,否则为0
Em que, r, s, u é o parâmetro de lisura. Este indicador reflete a proporção de variação de preço em relação ao valor absoluto de variação de preço, pertencente ao indicador de oscilação dinâmica. Em seguida, calculamos a média móvel de lisura EMA do Ergotic TSI como linha de sinal.
Análise de vantagens
As principais vantagens desta estratégia são:
- Capacidade de captação de tendências de mudança de preços
- O que é que a China está a fazer para reduzir a inflação?
- Com características de melhor desvio
- Parâmetros de configuração flexível, suavidade ajustável
Análise de Riscos
A estratégia também apresenta alguns riscos:
- A tendência é que os preços dos produtos de consumo sejam mais baixos do que os preços dos produtos de consumo.
- Parâmetros mal definidos podem perder oportunidades de negociação ou aumentar sinais falsos
- Parâmetros precisam ser adequadamente ajustados para diferentes variedades e ambientes de negociação
O risco pode ser controlado através de parâmetros de otimização, combinação de outros indicadores de confirmação e configuração de stop loss.
Direção de otimização
A estratégia pode ser melhorada em alguns aspectos:
- Teste diferentes entradas de preços, como preço de abertura, preço de fechamento, preço intermediário, etc.
- Ajustar os valores dos parâmetros de suavização r, s, u para encontrar a melhor combinação de parâmetros
- Adicionar outros indicadores ou condições de filtragem para confirmar ainda mais o sinal
- Estabelecer um ponto de parada e um mecanismo de saída
Resumir
Esta estratégia compreensível leva em consideração a mudança de dinâmica, o julgamento de tendências e o desvio de características, para capturar efetivamente as oportunidades de tendências. O melhor desempenho da estratégia pode ser obtido por meio de otimização de parâmetros, filtragem de sinais e controle de risco.
/*backtest
start: 2023-01-26 00:00:00
end: 2024-02-01 00:00:00
period: 1d
basePeriod: 1h
exchanges: [{"eid":"Futures_Binance","currency":"BTC_USDT"}]
*/

//@version = 2
////////////////////////////////////////////////////////////
//  Copyright by HPotter v1.0 13/12/2016
// r - Length of first EMA smoothing of 1 day momentum        4
// s - Length of second EMA smoothing of 1 day smoothing      8
// u- Length of third EMA smoothing of 1 day momentum         6
// Length of EMA signal line                                  3
// Source of Ergotic TSI                                      Close
//
// This is one of the techniques described by William Blau in his book "Momentum,
// Direction and Divergence" (1995). If you like to learn more, we advise you to
// read this book. His book focuses on three key aspects of trading: momentum,
// direction and divergence. Blau, who was an electrical engineer before becoming
// a trader, thoroughly examines the relationship between price and momentum in
// step-by-step examples. From this grounding, he then looks at the deficiencies
// in other oscillators and introduces some innovative techniques, including a
// fresh twist on Stochastics. On directional issues, he analyzes the intricacies
// of ADX and offers a unique approach to help define trending and non-trending periods.
//
// You can use in the xPrice any series: Open, High, Low, Close, HL2, HLC3, OHLC4 and ect...
// You can change long to short in the Input Settings
// Please, use it only for learning or paper trading. Do not for real trading.
////////////////////////////////////////////////////////////
strategy(title="Ergotic TSI Strategy Backtest")
r = input(4, minval=1)
s = input(8, minval=1)
u = input(6, minval=1)
SmthLen = input(3, minval=1)
reverse = input(false, title="Trade reverse")
hline(0, color=blue, linestyle=line)
xPrice = close
xPrice1 = xPrice - xPrice[1]
xPrice2 = abs(xPrice - xPrice[1])
xSMA_R = ema(ema(ema(xPrice1,r), s),u)
xSMA_aR = ema(ema(ema(xPrice2, r), s),u)
Val1 = 100 * xSMA_R
Val2 = xSMA_aR
xTSI = iff (Val2 != 0, Val1 / Val2, 0)
xEMA_TSI = ema(xTSI, SmthLen)
pos = iff(xTSI > xEMA_TSI, 1,
	   iff(xTSI < xEMA_TSI, -1, nz(pos[1], 0)))
possig = iff(reverse and pos == 1, -1,
          iff(reverse and pos == -1, 1, pos))
if (possig == 1)
    strategy.entry("Long", strategy.long)
if (possig == -1)
    strategy.entry("Short", strategy.short)
barcolor(possig == -1 ? red: possig == 1 ? green : blue )
plot(xTSI, color=green, title="Ergotic TSI")
plot(xEMA_TSI, color=red, title="SigLin")