Estratégia de acompanhamento de tendência baseada em RSI
Visão geral
De acordo com a análise técnica, o indicador RSI acima de 70 deve representar um estado de sobrevenda e, portanto, pertence a um sinal de venda. As criptomoedas representam uma nova categoria de ativos, que reformula o conceito de análise técnica. As compras FOMO podem gerar uma força muito forte, permitindo que os ativos digitais permaneçam sob o estado de sobrevenda por um tempo suficiente, oferecendo uma boa oportunidade de negociação em curta linha para acompanhar a tendência ascendente.
Construir uma estratégia de negociação de tendências baseada no RSI, que geralmente é considerado um indicador de reversão, pode parecer contra-intuitivo. Mas, com mais de 200 testes retrospectivos, é um cenário de estratégia de longo prazo muito interessante.
Princípio da estratégia
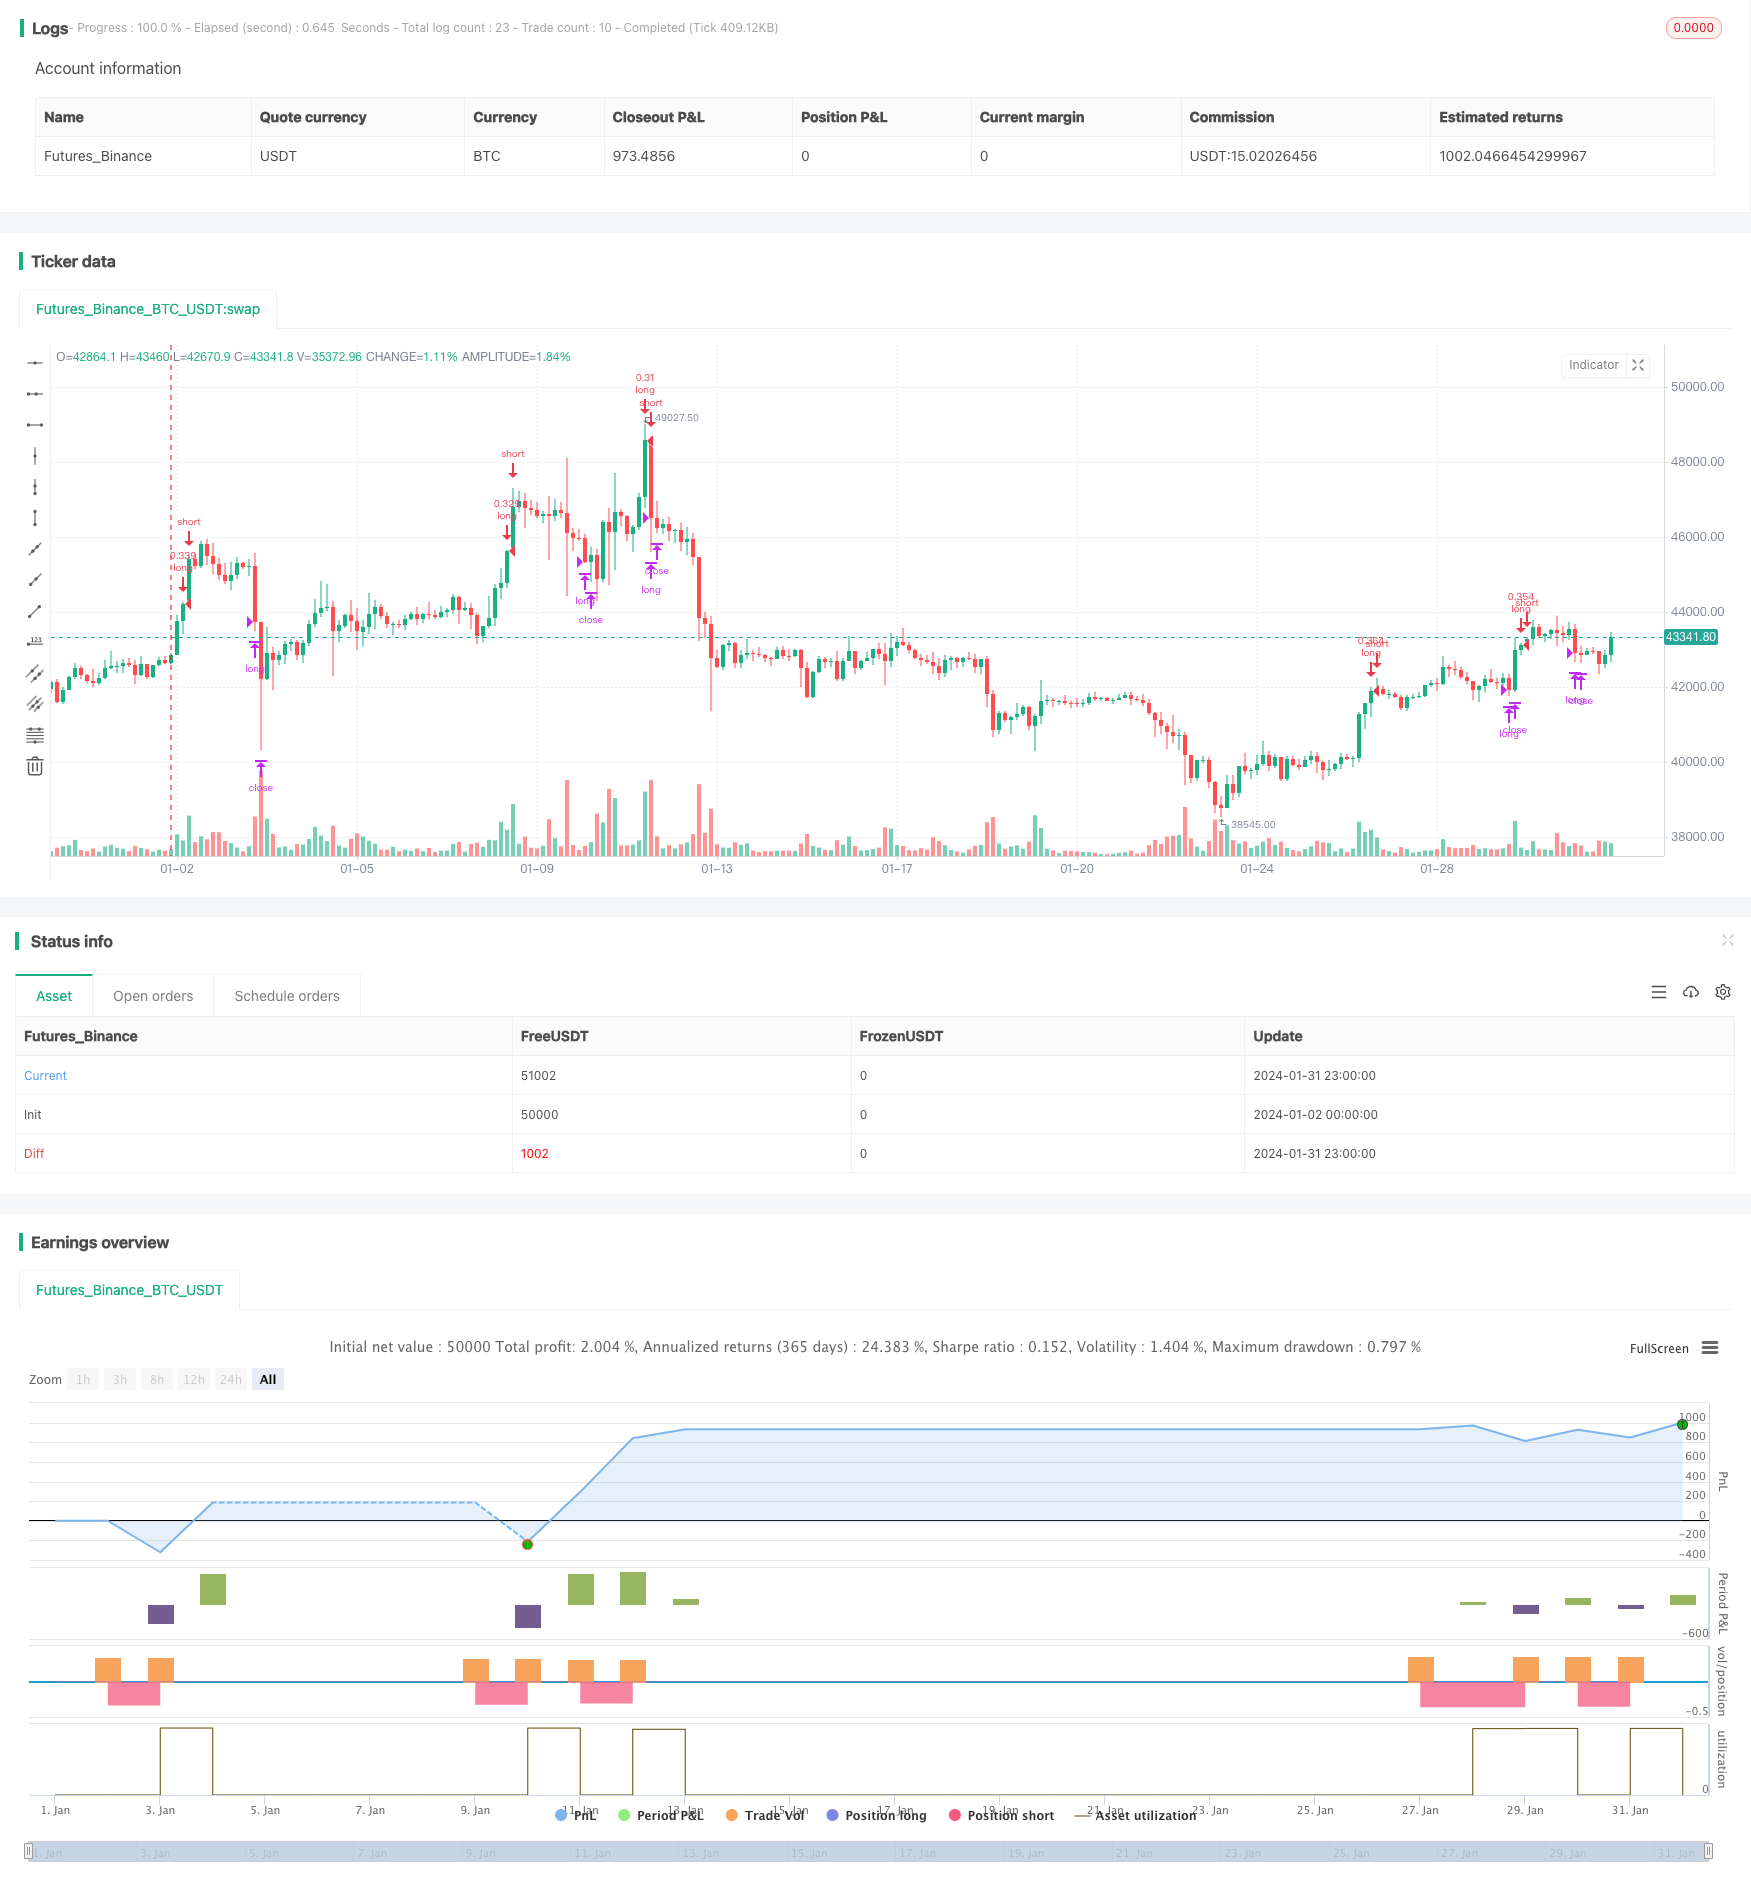
A estratégia assume 30% do capital disponível para cada ordem de negociação. Uma taxa de transação de 0,1% é levada em consideração, o que corresponde à taxa básica da Binance (a maior exchange de criptomoedas do mundo).
- Entrando em sinal: quando o RSI é maior que 70 e faz mais quando está dentro da janela de retorno
- Sinais de saída: fechamento quando o RSI é menor que 55 ou quando o preço de fechamento é maior que o preço de parada
Análise de vantagens
- Utilize o RSI para identificar tendências e evitar sinais perdidos em situações de turbulência
- Gerenciamento de posições de liquidez, controle efetivo de perdas individuais
- Apto para a posse de linha média e longa, para evitar ser atingido por flutuações de curto prazo
Análise de Riscos
- Certifique-se de que os parâmetros do RSI estão corretamente definidos, pois podem gerar sinais errôneos em overbought e oversold
- O rastreamento de paradas precisa ser atualizado em tempo hábil, ou você pode perder lucros
- Atenção ao risco de variação anormal do mercado, ajuste de posição ou parada de prejuízos, se necessário
Direção de otimização
- Tendências de avaliação podem ser consideradas em combinação com outros indicadores, como o MACD
- Pode testar diferentes configurações de parâmetros RSI
- Pode ser introduzido um stop-loss dinâmico, que ajusta automaticamente o preço do stop-loss de acordo com as flutuações do mercado
Resumir
Esta estratégia usa o indicador RSI para identificar a direção da tendência de overbought e para traçar a tendência ascendente. Em comparação com o uso tradicional do RSI para o descenso, esta estratégia oferece novas ideias.
/*backtest
start: 2024-01-02 00:00:00
end: 2024-02-01 00:00:00
period: 3h
basePeriod: 15m
exchanges: [{"eid":"Futures_Binance","currency":"BTC_USDT"}]
*/

//@version=1
strategy(shorttitle='Trend-following RSI Scalping Strategy (by Coinrule)',title='Trend-following RSI Strategy ', overlay=true, initial_capital = 1000, default_qty_type = strategy.percent_of_equity, default_qty_type = strategy.percent_of_equity, default_qty_value = 30, commission_type=strategy.commission.percent, commission_value=0.1)

//Backtest dates
fromMonth = input(defval = 1,  title = "From Month")
fromDay   = input(defval = 10,    title = "From Day")
fromYear  = input(defval = 2020, title = "From Year")
thruMonth = input(defval = 1,    title = "Thru Month")
thruDay   = input(defval = 1,    title = "Thru Day")
thruYear  = input(defval = 2112, title = "Thru Year")

showDate  = input(defval = true, title = "Show Date Range")

start     = timestamp(fromYear, fromMonth, fromDay, 00, 00)        // backtest start window
finish    = timestamp(thruYear, thruMonth, thruDay, 23, 59)        // backtest finish window
window()  => true


// RSI inputs and calculations
lengthRSI = input(14, title = 'RSI period', minval=1)
RSI = rsi(close, lengthRSI)

//Entry


strategy.entry(id="long", long = true, when = RSI > 70 and window())

//Exit

Take_profit= ((input (6))/100)
longTakeProfit = strategy.position_avg_price * (1 + Take_profit)

strategy.close("long", when = RSI < 55 or close > longTakeProfit and window())