Estratégia de negociação de tendências com base na divergência de preços
Visão geral
A estratégia é uma estratégia de negociação de tendências baseada em sinais de dispersação de preços. Ela usa vários indicadores para detectar sinais de dispersação de preços, como RSI, MACD, Stochastics, etc., e é confirmada pelo oscilador Murray Math.
Princípio da estratégia
O núcleo da estratégia é a teoria da dispersão de preços. Quando os preços são inovadores e os indicadores não são inovadores, é chamado de dispersão de preços de mercado de urso. Quando os preços são inovadores e os indicadores não são inovadores, é chamado de dispersão de preços de mercado de touro.
A estratégia inclui os seguintes critérios:
- Detecção de sinais de dispersação de preços, incluindo dispersação regular e dispersação oculta
- Os osciladores de Murrey Math estão dentro da zona de tendência correspondente
As condições de saída são que os osciladores se equilibrem quando atravessam a linha central.
Análise de vantagens
A estratégia combina a teoria da dispersação de preços e a confirmação de tendências, com as seguintes vantagens:
- Utilizando sinais de dispersação de preços para detectar potenciais reviravoltas de tendência
- Aplica osciladores para confirmar tendências atuais e evitar falsas rupturas
- Diversos indicadores e combinações de parâmetros, com flexibilidade
- Seguir as tendências e evitar perdas
- Regras de lógica claras, espaço para otimizar o código
Análise de Riscos
Os principais riscos são os seguintes:
- Os sinais de dispersação de preços podem ser falsos e não confirmam completamente a reversão da tendência
- A configuração incorreta dos parâmetros do oscilador pode levar a oportunidades de negociação perdidas
- Excesso de inclinação de posições em aberto leva a maiores riscos de perdas
- A volatilidade pode aumentar o número de transações e os custos de deslizamento
Recomenda-se a configuração de stop loss, ajuste de posição e otimização de parâmetros para reduzir o risco.
Direção de otimização
A estratégia ainda tem espaço para ser melhorada:
- Adição de algoritmos de aprendizagem de máquina para otimizar conjuntos de parâmetros em tempo real
- Aumentar a tecnologia de stop-loss adaptativa, como stop-loss tracking, stop-loss average, etc.
- Melhoria do índice de ruído de comunicação, combinado com mais indicadores e condições de filtragem
- Ajuste dinâmico dos parâmetros do oscilador para otimizar o julgamento de tendências
- Optimizar a gestão de riscos, definir limites de retirada máxima, etc.
Resumir
A estratégia integra a teoria da dispersação de preços e os indicadores de análise de tendências para detectar efetivamente os potenciais pontos de mudança de tendência. Em combinação com medidas de gerenciamento de risco otimizadas, uma melhor taxa de retorno da estratégia pode ser obtida.
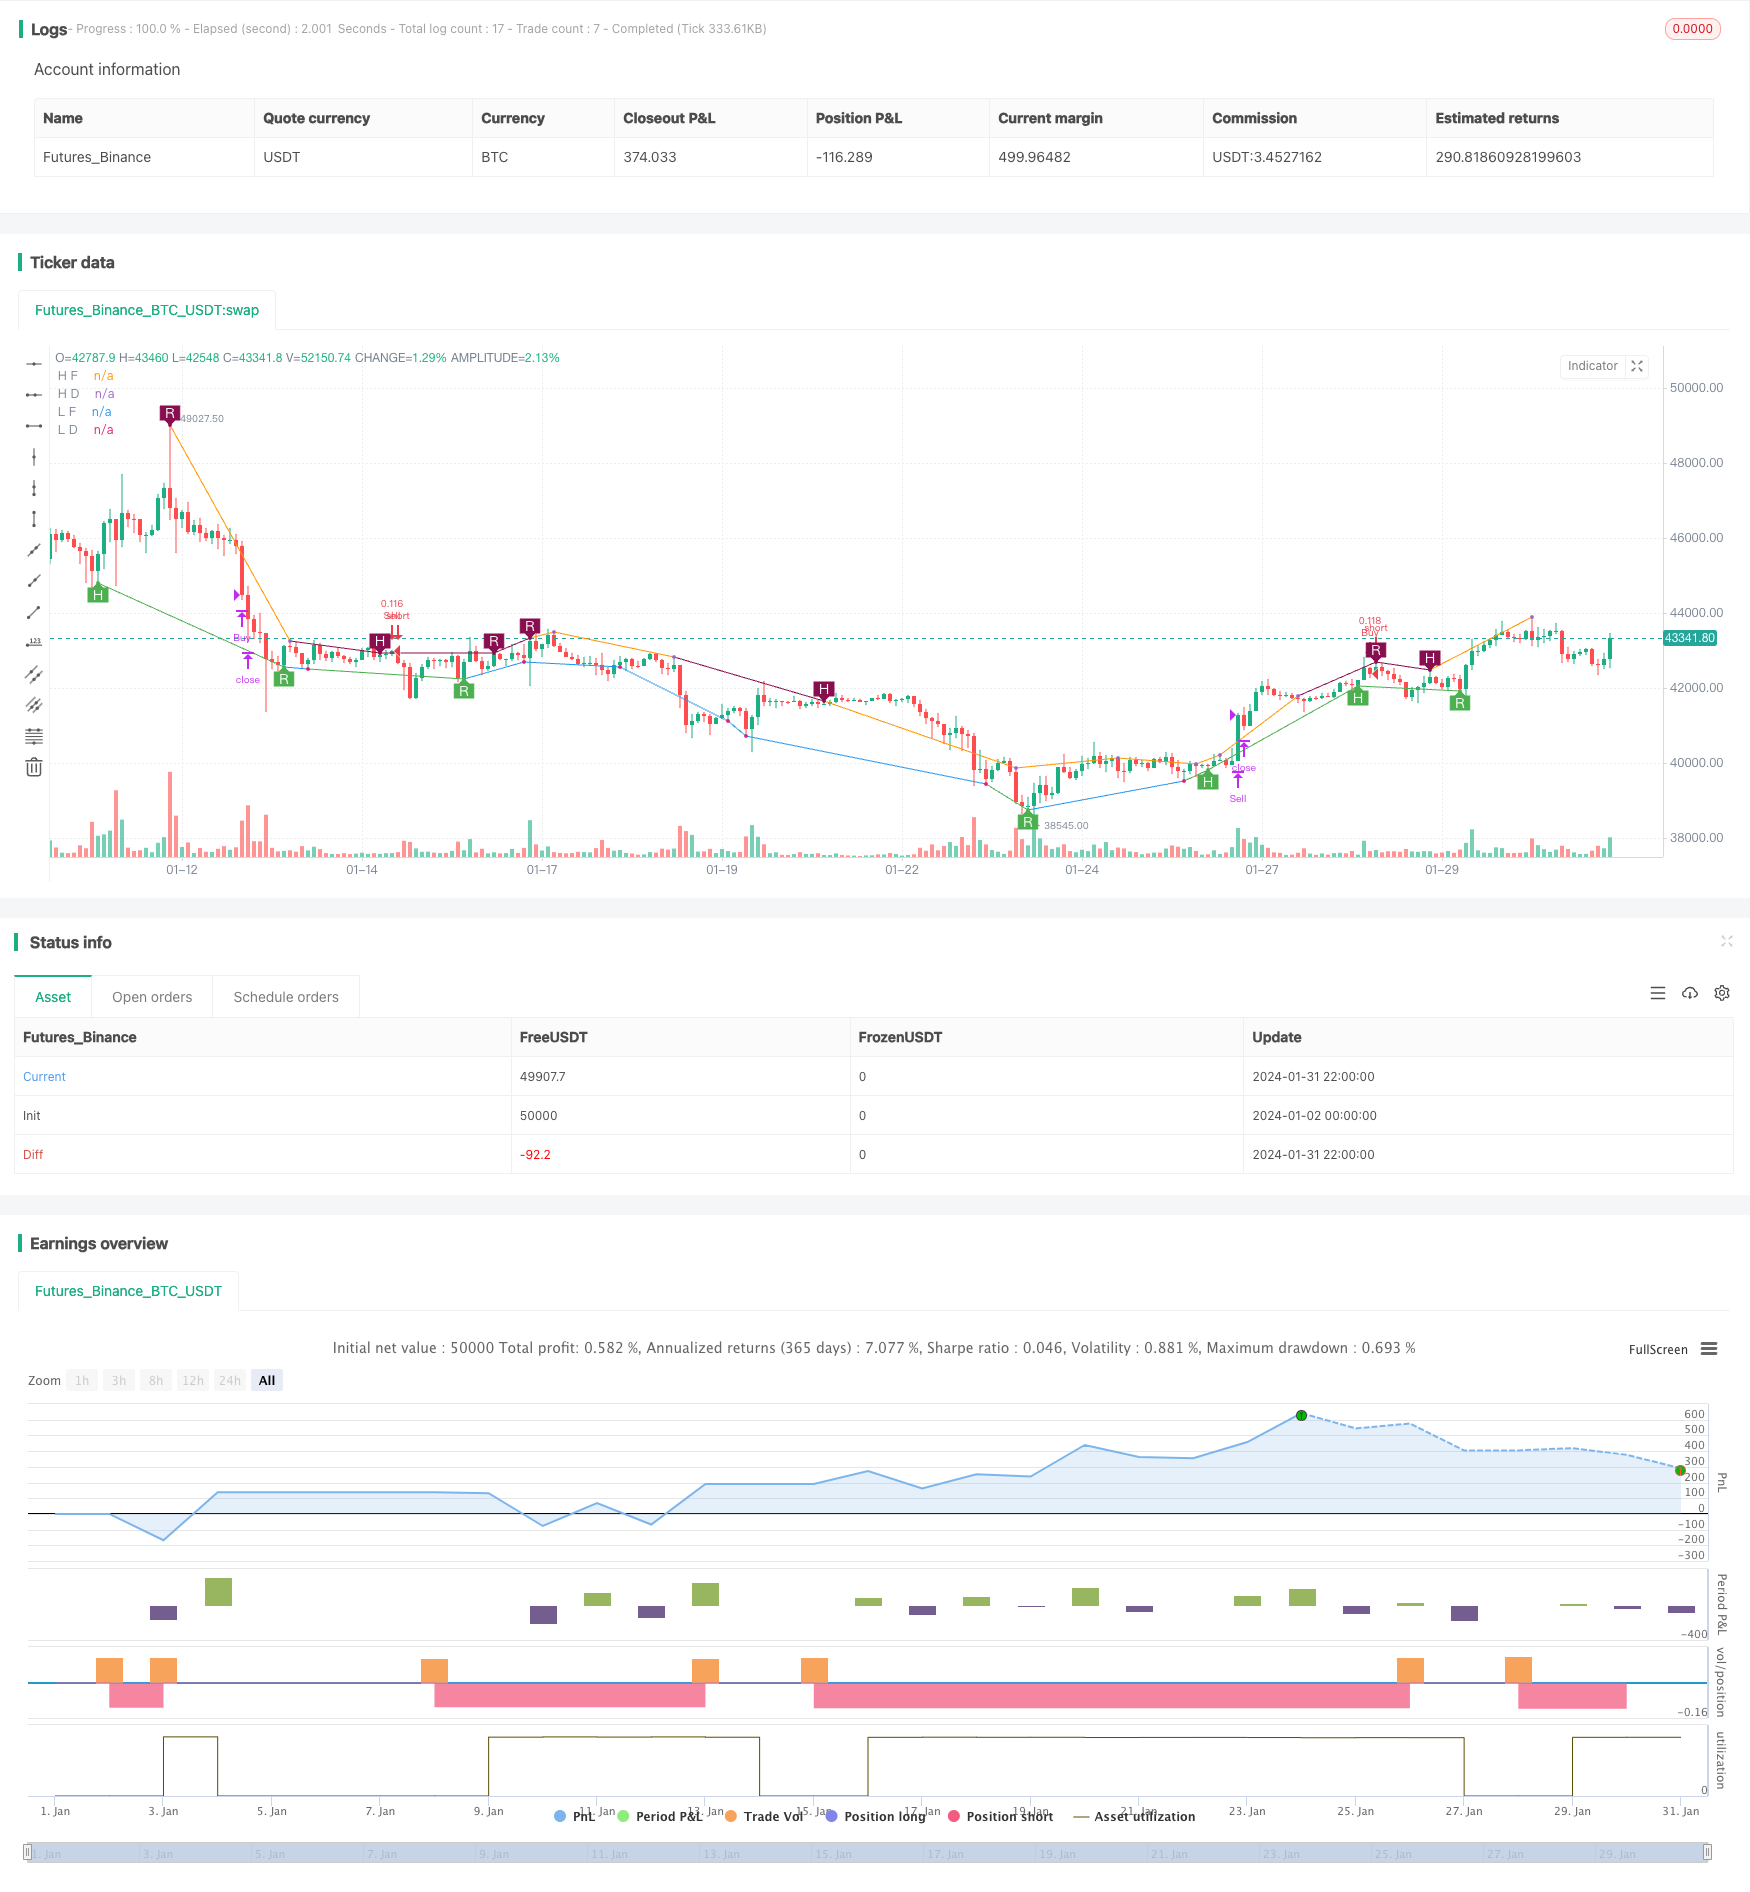
/*backtest
start: 2024-01-02 00:00:00
end: 2024-02-01 00:00:00
period: 2h
basePeriod: 15m
exchanges: [{"eid":"Futures_Binance","currency":"BTC_USDT"}]
*/

//@version=2
//
// Title:   [STRATEGY][UL]Price Divergence Strategy V1
// Author:  JustUncleL
// Date:    23-Oct-2016
// Version: v1.0
//
// Description:
//  A trend trading strategy the uses Price Divergence detection signals, that
//  are confirmed by the "Murrey's Math Oscillator" (Donchanin Channel based).
//
//  *** USE AT YOUR OWN RISK ***
//
// Mofidifications:
//  1.0 - original
//
// References:
//  Strategy Based on:
//  - [RS]Price Divergence Detector V2 by RicardoSantos
//  - UCS_Murrey's Math Oscillator by Ucsgears
//  Some Code borrowed from:
//  - "Strategy Code Example by JayRogers"
//  Information on Divergence Trading:
//  - http://www.babypips.com/school/high-school/trading-divergences
//
strategy(title='[STRATEGY][UL]Price Divergence Strategy v1.0', pyramiding=0, overlay=true, initial_capital=10000, calc_on_every_tick=false,
         currency=currency.USD,default_qty_type=strategy.percent_of_equity,default_qty_value=10)
//  ||  General Input:
method = input(title='Method (0=rsi, 1=macd, 2=stoch, 3=volume, 4=acc/dist, 5=fisher, 6=cci):',  defval=1, minval=0, maxval=6)
SHOW_LABEL = input(title='Show Labels', type=bool, defval=true)
SHOW_CHANNEL = input(title='Show Channel', type=bool, defval=false)
uHid = input(true,title="Use Hidden Divergence in Strategy")
uReg = input(true,title="Use Regular Divergence in Strategy")
//  ||  RSI / STOCH / VOLUME / ACC/DIST Input:
rsi_smooth = input(title='RSI/STOCH/Volume/ACC-DIST/Fisher/cci Smooth:',  defval=5)
//  ||  MACD Input:
macd_src = input(title='MACD Source:', defval=close)
macd_fast = input(title='MACD Fast:',  defval=12)
macd_slow = input(title='MACD Slow:',  defval=26)
macd_smooth = input(title='MACD Smooth Signal:',  defval=9)
//  ||  Functions:
f_top_fractal(_src)=>_src[4] < _src[2] and _src[3] < _src[2] and _src[2] > _src[1] and _src[2] > _src[0]
f_bot_fractal(_src)=>_src[4] > _src[2] and _src[3] > _src[2] and _src[2] < _src[1] and _src[2] < _src[0]
f_fractalize(_src)=>f_top_fractal(_src) ? 1 : f_bot_fractal(_src) ? -1 : 0

//  ||••>   START MACD FUNCTION
f_macd(_src, _fast, _slow, _smooth)=>
    _fast_ma = sma(_src, _fast)
    _slow_ma = sma(_src, _slow)
    _macd = _fast_ma-_slow_ma
    _signal = ema(_macd, _smooth)
    _hist = _macd - _signal
//  ||<••   END MACD FUNCTION

//  ||••>   START ACC/DIST FUNCTION
f_accdist(_smooth)=>_return=sma(cum(close==high and close==low or high==low ? 0 : ((2*close-low-high)/(high-low))*volume), _smooth)
//  ||<••   END ACC/DIST FUNCTION

//  ||••>   START FISHER FUNCTION
f_fisher(_src, _window)=>
    _h = highest(_src, _window)
    _l = lowest(_src, _window)
    _value0 = .66 * ((_src - _l) / max(_h - _l, .001) - .5) + .67 * nz(_value0[1])
    _value1 = _value0 > .99 ? .999 : _value0 < -.99 ? -.999 : _value0
    _fisher = .5 * log((1 + _value1) / max(1 - _value1, .001)) + .5 * nz(_fisher[1])
//  ||<••   END FISHER FUNCTION

method_high = method == 0 ? rsi(high, rsi_smooth) :
  method == 1 ? f_macd(macd_src, macd_fast, macd_slow, macd_smooth) :
  method == 2 ? stoch(close, high, low, rsi_smooth) :
  method == 3 ? sma(volume, rsi_smooth) :
  method == 4 ? f_accdist(rsi_smooth) :
  method == 5 ? f_fisher(high, rsi_smooth) :
  method == 6 ? cci(high, rsi_smooth) :
  na

method_low = method == 0 ? rsi(low, rsi_smooth) :
  method == 1 ? f_macd(macd_src, macd_fast, macd_slow, macd_smooth) :
  method == 2 ? stoch(close, high, low, rsi_smooth) :
  method == 3 ? sma(volume, rsi_smooth) :
  method == 4 ? f_accdist(rsi_smooth) :
  method == 5 ? f_fisher(low, rsi_smooth) :
  method == 6 ? cci(low, rsi_smooth) :
  na

fractal_top = f_fractalize(method_high) > 0 ? method_high[2] : na
fractal_bot = f_fractalize(method_low) < 0 ? method_low[2] : na

high_prev = valuewhen(fractal_top, method_high[2], 1)
high_price = valuewhen(fractal_top, high[2], 1)
low_prev = valuewhen(fractal_bot, method_low[2], 1)
low_price = valuewhen(fractal_bot, low[2], 1)

regular_bearish_div = fractal_top and high[2] > high_price and method_high[2] < high_prev
hidden_bearish_div = fractal_top and high[2] < high_price and method_high[2] > high_prev
regular_bullish_div = fractal_bot and low[2] < low_price and method_low[2] > low_prev
hidden_bullish_div = fractal_bot and low[2] > low_price and method_low[2] < low_prev

plot(title='H F', series=fractal_top ? high[2] : na, color=regular_bearish_div or hidden_bearish_div ? maroon : not SHOW_CHANNEL ? na : silver, offset=-2)
plot(title='L F', series=fractal_bot ? low[2] : na, color=regular_bullish_div or hidden_bullish_div ? green : not SHOW_CHANNEL ? na : silver, offset=-2)
plot(title='H D', series=fractal_top ? high[2] : na, style=circles, color=regular_bearish_div or hidden_bearish_div ? maroon : not SHOW_CHANNEL ? na : silver, linewidth=3, offset=-2)
plot(title='L D', series=fractal_bot ? low[2] : na, style=circles, color=regular_bullish_div or hidden_bullish_div ? green : not SHOW_CHANNEL ? na : silver, linewidth=3, offset=-2)

plotshape(title='+RBD', series=not SHOW_LABEL ? na : regular_bearish_div ? high[2] : na, text='R', style=shape.labeldown, location=location.absolute, color=maroon, textcolor=white, offset=-2)
plotshape(title='+HBD', series=not SHOW_LABEL ? na : hidden_bearish_div ? high[2] : na, text='H', style=shape.labeldown, location=location.absolute, color=maroon, textcolor=white, offset=-2)
plotshape(title='-RBD', series=not SHOW_LABEL ? na : regular_bullish_div ? low[2] : na, text='R', style=shape.labelup, location=location.absolute, color=green, textcolor=white, offset=-2)
plotshape(title='-HBD', series=not SHOW_LABEL ? na : hidden_bullish_div ? low[2] : na, text='H', style=shape.labelup, location=location.absolute, color=green, textcolor=white, offset=-2)

// Code borrowed from UCS_Murrey's Math Oscillator by Ucsgears
//  - UCS_MMLO
// Inputs
length = input(100, minval = 10, title = "MMLO Look back Length")
quad   = input(2, minval = 1, maxval = 4, step = 1, title = "Mininum Quadrant for MMLO Support")
mult = 0.125

// Donchanin Channel
hi = highest(high, length)
lo = lowest(low, length)
range = hi - lo
multiplier = (range) * mult
midline = lo + multiplier * 4

oscillator = (close - midline)/(range/2)

a = oscillator > 0
b = oscillator > 0 and oscillator > mult*2
c = oscillator > 0 and oscillator > mult*4
d = oscillator > 0 and oscillator > mult*6

z = oscillator < 0
y = oscillator < 0 and oscillator < -mult*2
x = oscillator < 0 and oscillator < -mult*4
w = oscillator < 0 and oscillator < -mult*6


//  Strategy: (Thanks to JayRogers)
// === STRATEGY RELATED INPUTS ===
//tradeInvert     = input(defval = false, title = "Invert Trade Direction?")
// the risk management inputs
inpTakeProfit   = input(defval = 0, title = "Take Profit Points", minval = 0)
inpStopLoss     = input(defval = 0, title = "Stop Loss Points", minval = 0)
inpTrailStop    = input(defval = 100, title = "Trailing Stop Loss Points", minval = 0)
inpTrailOffset  = input(defval = 0, title = "Trailing Stop Loss Offset Points", minval = 0)

// === RISK MANAGEMENT VALUE PREP ===
// if an input is less than 1, assuming not wanted so we assign 'na' value to disable it.
useTakeProfit   = inpTakeProfit  >= 1 ? inpTakeProfit  : na
useStopLoss     = inpStopLoss    >= 1 ? inpStopLoss    : na
useTrailStop    = inpTrailStop   >= 1 ? inpTrailStop   : na
useTrailOffset  = inpTrailOffset >= 1 ? inpTrailOffset : na

// === STRATEGY - LONG POSITION EXECUTION ===
enterLong() => ((uReg and regular_bullish_div) or (uHid and hidden_bullish_div)) and (quad==1? a[1]: quad==2?b[1]: quad==3?c[1]: quad==4?d[1]: false)// functions can be used to wrap up and work out complex conditions
exitLong() => oscillator <= 0
strategy.entry(id = "Buy", long = true, when = enterLong() )// use function or simple condition to decide when to get in
strategy.close(id = "Buy", when = exitLong() )// ...and when to get out

// === STRATEGY - SHORT POSITION EXECUTION ===
enterShort() => ((uReg and regular_bearish_div) or (uHid and hidden_bearish_div)) and (quad==1? z[1]: quad==2?y[1]: quad==3?x[1]: quad==4?w[1]: false)
exitShort() => oscillator >= 0
strategy.entry(id = "Sell", long = false, when = enterShort())
strategy.close(id = "Sell", when = exitShort() )

// === STRATEGY RISK MANAGEMENT EXECUTION ===
// finally, make use of all the earlier values we got prepped
strategy.exit("Exit Buy", from_entry = "Buy", profit = useTakeProfit, loss = useStopLoss, trail_points = useTrailStop, trail_offset = useTrailOffset)
strategy.exit("Exit Sell", from_entry = "Sell", profit = useTakeProfit, loss = useStopLoss, trail_points = useTrailStop, trail_offset = useTrailOffset)


//EOF