Estratégia de Trailing Stop Loss de Média Móvel Dupla
Visão geral
Esta estratégia é capaz de monitorar a tendência do mercado e, em seguida, fazer uma parada em tempo hábil após o lucro.
Princípio da estratégia
- Média móvel rápida (EMA): O parâmetro é a média móvel de 12 dias do índice, capaz de responder rapidamente às mudanças de preço.
- Média móvel lenta (SMA): o parâmetro é a média móvel simples de 45 dias, que representa a tendência de longo prazo.
- Quando uma média móvel rápida atravessa uma média móvel lenta, gera um sinal de compra.
- Calcule a média real de flutuação de 15 dias (ATR) como referência de stop loss.
- De acordo com o valor do ATR, configure a amplitude de parada de rastreamento (como 6 vezes o ATR) e atualize o preço de parada em tempo real.
- Quando o preço está abaixo do preço de parada, um sinal de venda é gerado.
A estratégia combina o rastreamento de tendências e o gerenciamento de stop loss, permitindo tanto o rastreamento da direção da linha média quanto o controle de perdas individuais por meio do stop loss.
Análise de vantagens
- A combinação de médias móveis permite identificar tendências com eficiência, aumentando a confiabilidade do sinal.
- O stop loss de rastreamento dinâmico pode ser parado em tempo hábil, evitando o impacto da força de capital.
- A combinação com o ATR faz com que o preço de parada seja razoável e evita que seja sensível.
- A estratégia é clara e fácil de entender, e os parâmetros podem ser ajustados com flexibilidade.
Análise de Riscos
- A média móvel está atrasada e pode ter perdido uma oportunidade de curta-circuito.
- A perda de capital é muito baixa e pode prejudicar a rentabilidade.
- O excesso de sensitividade do stop loss pode aumentar a frequência de transações e a carga de comissões.
- A variação da taxa de flutuação das ações pode afetar a estabilidade do parâmetro ATR.
Os parâmetros de média móvel podem ser apropriadamente otimizados, ou o ATR pode ser ajustado para equilibrar o stop loss. Outros indicadores podem ser combinados como condições de filtragem para melhorar o tempo de entrada.
Direção de otimização
- Teste mais combinações de parâmetros para escolher a melhor média móvel.
- Ajustar o parâmetro do múltiplo do ATR de stop loss de acordo com as características de diferentes ações.
- Aumentar as condições de filtragem, como indicadores de preços e quantidades, para evitar transações desnecessárias.
- Acumular mais testes de dados históricos para verificar a estabilidade dos parâmetros.
Resumir
Esta estratégia combina com sucesso o rastreamento de tendências da média móvel e o stop loss dinâmico do ATR, que pode ser adaptado a diferentes características de ações por meio de otimização de parâmetros. A estratégia forma um limite de compra e parada claro e claro, tornando a lógica de negociação simples.
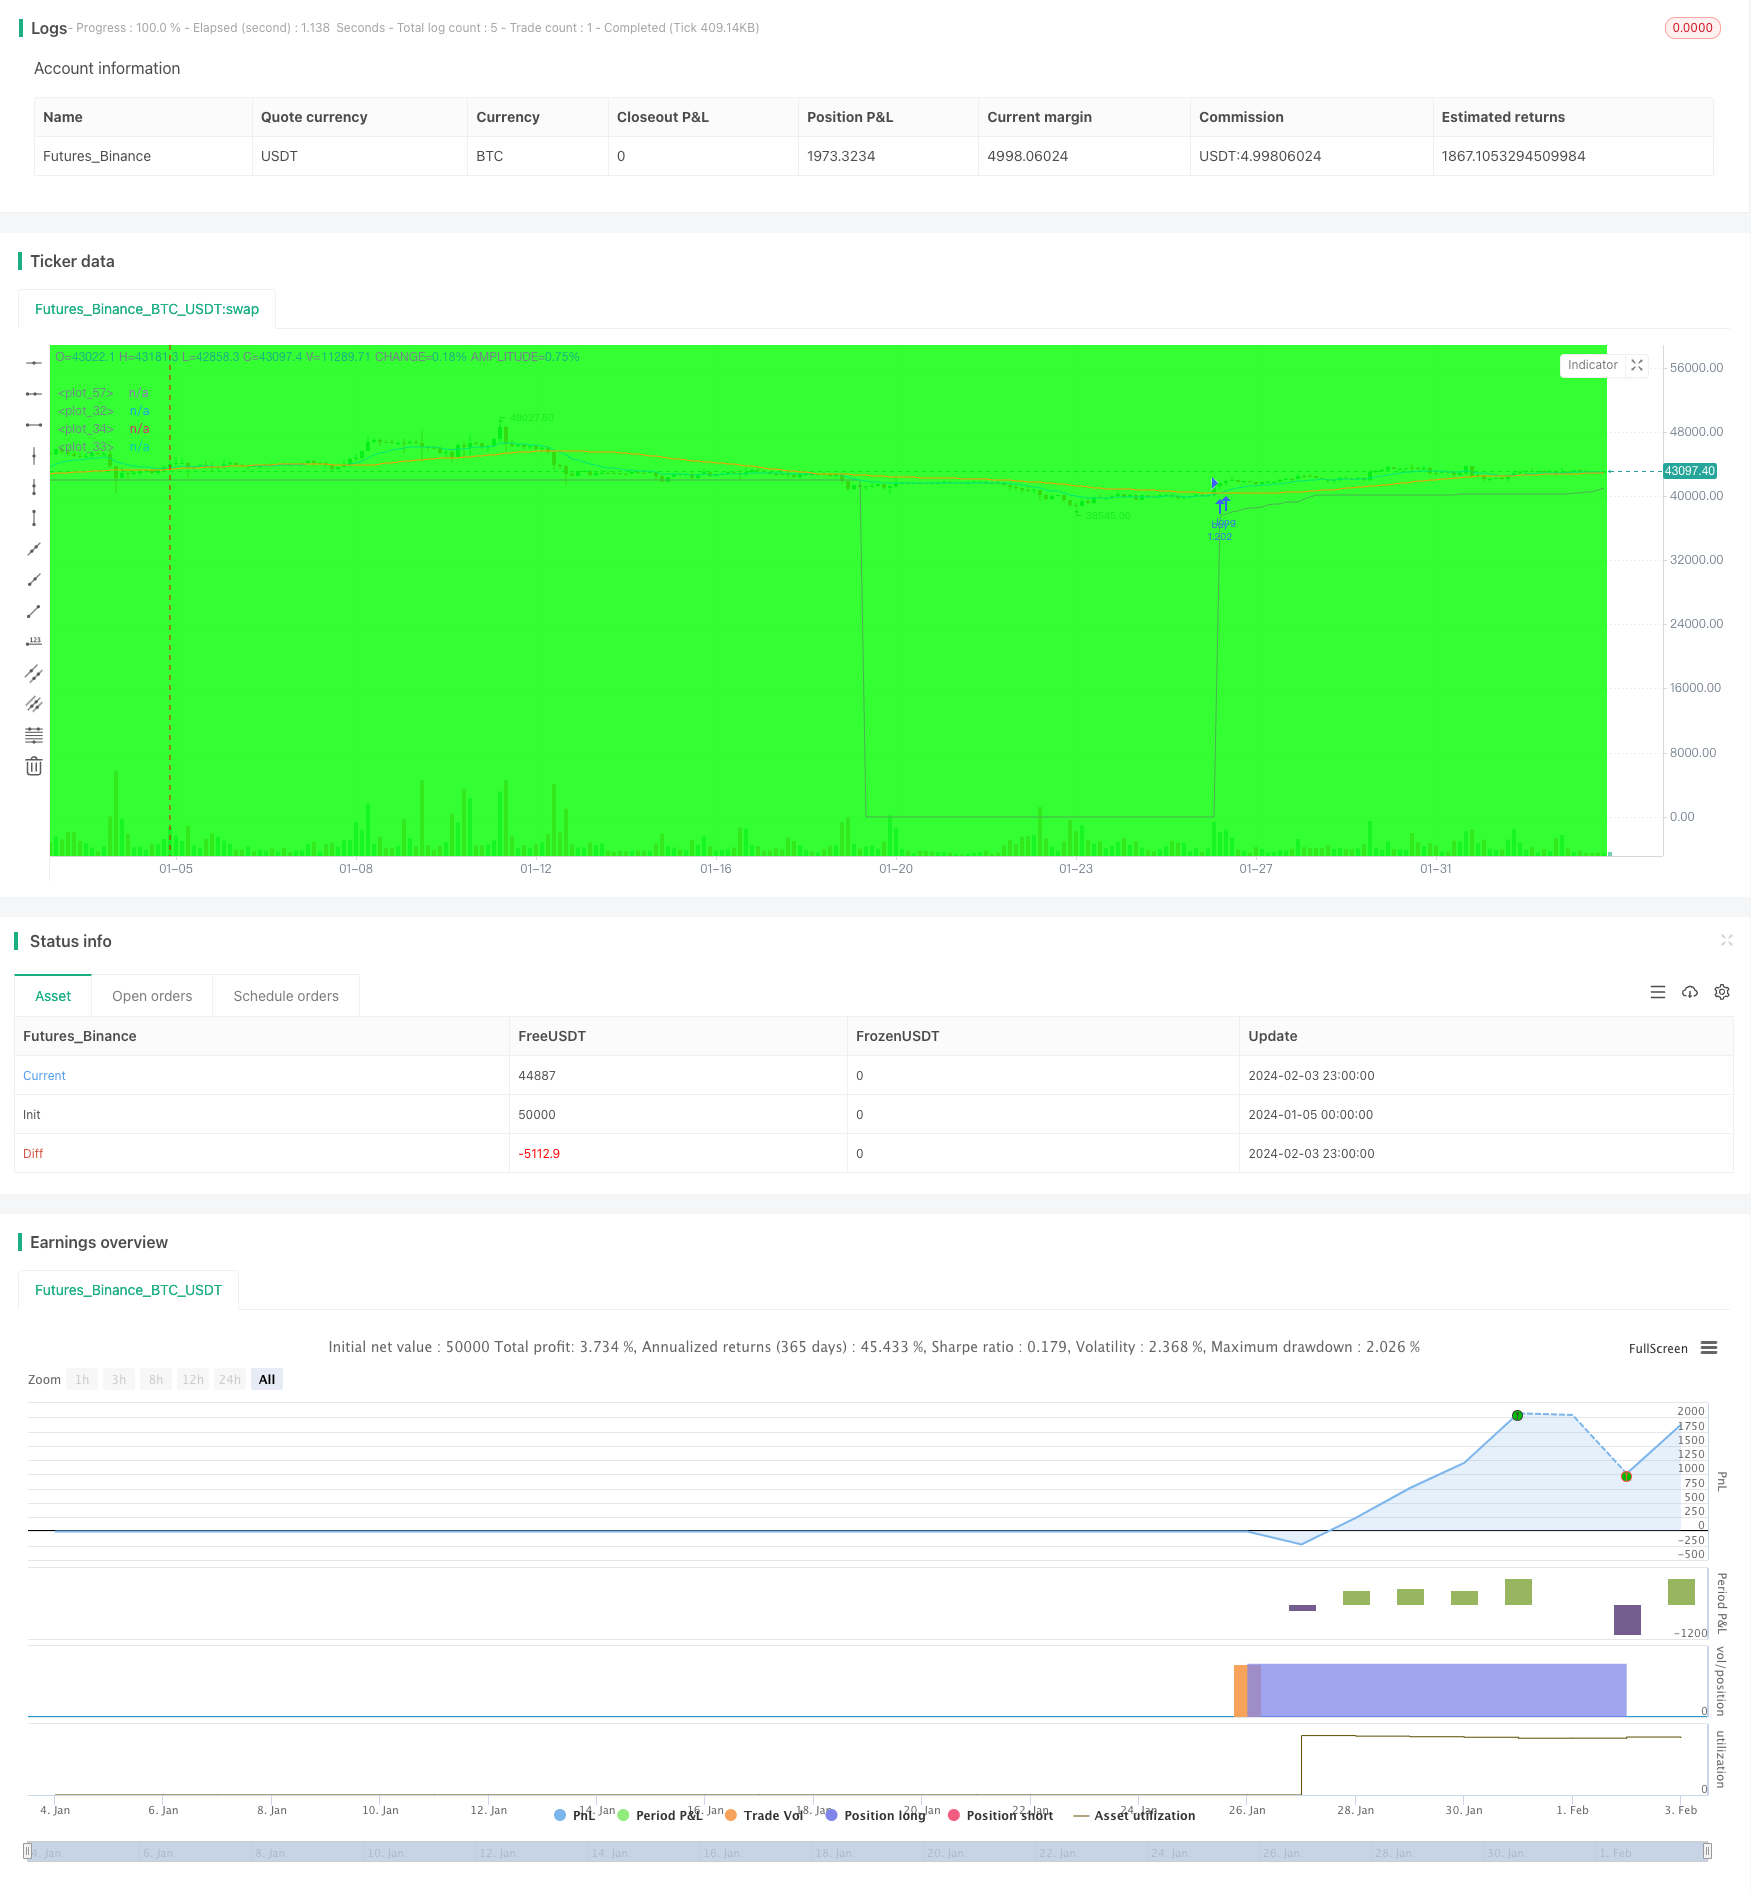
/*backtest
start: 2024-01-05 00:00:00
end: 2024-02-04 00:00:00
period: 3h
basePeriod: 15m
exchanges: [{"eid":"Futures_Binance","currency":"BTC_USDT"}]
*/

//@version=2
//created by XPloRR 24-02-2018

strategy("XPloRR MA-Buy ATR-MA-Trailing-Stop Strategy",overlay=true, initial_capital=1000,default_qty_type=strategy.percent_of_equity,default_qty_value=100)

testStartYear = input(2005, "Start Year")
testStartMonth = input(1, "Start Month")
testStartDay = input(1, "Start Day")
testPeriodStart = timestamp(testStartYear,testStartMonth,testStartDay,0,0)

testStopYear = input(2050, "Stop Year")
testStopMonth = input(12, "Stop Month")
testStopDay = input(31, "Stop Day")
testPeriodStop = timestamp(testStopYear,testStopMonth,testStopDay,0,0)

testPeriodBackground = input(title="Background", type=bool, defval=true)
testPeriodBackgroundColor = testPeriodBackground and (time >= testPeriodStart) and (time <= testPeriodStop) ? #00FF00 : na
bgcolor(testPeriodBackgroundColor, transp=97)

emaPeriod = input(12, "Exponential MA")
smaPeriod = input(45, "Simple MA")
stopPeriod = input(12, "Stop EMA")
delta = input(6, "Trailing Stop #ATR")

testPeriod() => true

emaval=ema(close,emaPeriod)
smaval=sma(close,smaPeriod)
stopval=ema(close,stopPeriod)
atr=sma((high-low),15)

plot(emaval, color=blue,linewidth=1)
plot(smaval, color=orange,linewidth=1)
plot(stopval, color=lime,linewidth=1)

long=crossover(emaval,smaval)
short=crossunder(emaval,smaval)

//buy-sell signal
stop=0
inlong=0
if testPeriod()
    if (long and (not inlong[1]))
        strategy.entry("buy",strategy.long)
        inlong:=1
        stop:=emaval-delta*atr
    else
        stop:=iff((nz(emaval)>(nz(stop[1])+delta*atr))and(inlong[1]),emaval-delta*atr,nz(stop[1]))
        inlong:=nz(inlong[1])
        if ((stopval<stop) and (inlong[1]))
            strategy.close("buy")
            inlong:=0
            stop:=0
else
    inlong:=0
    stop:=0
plot(stop,color=green,linewidth=1)