Estratégia de Backtesting da Linha de Extensão de Preço Futuro
Visão geral
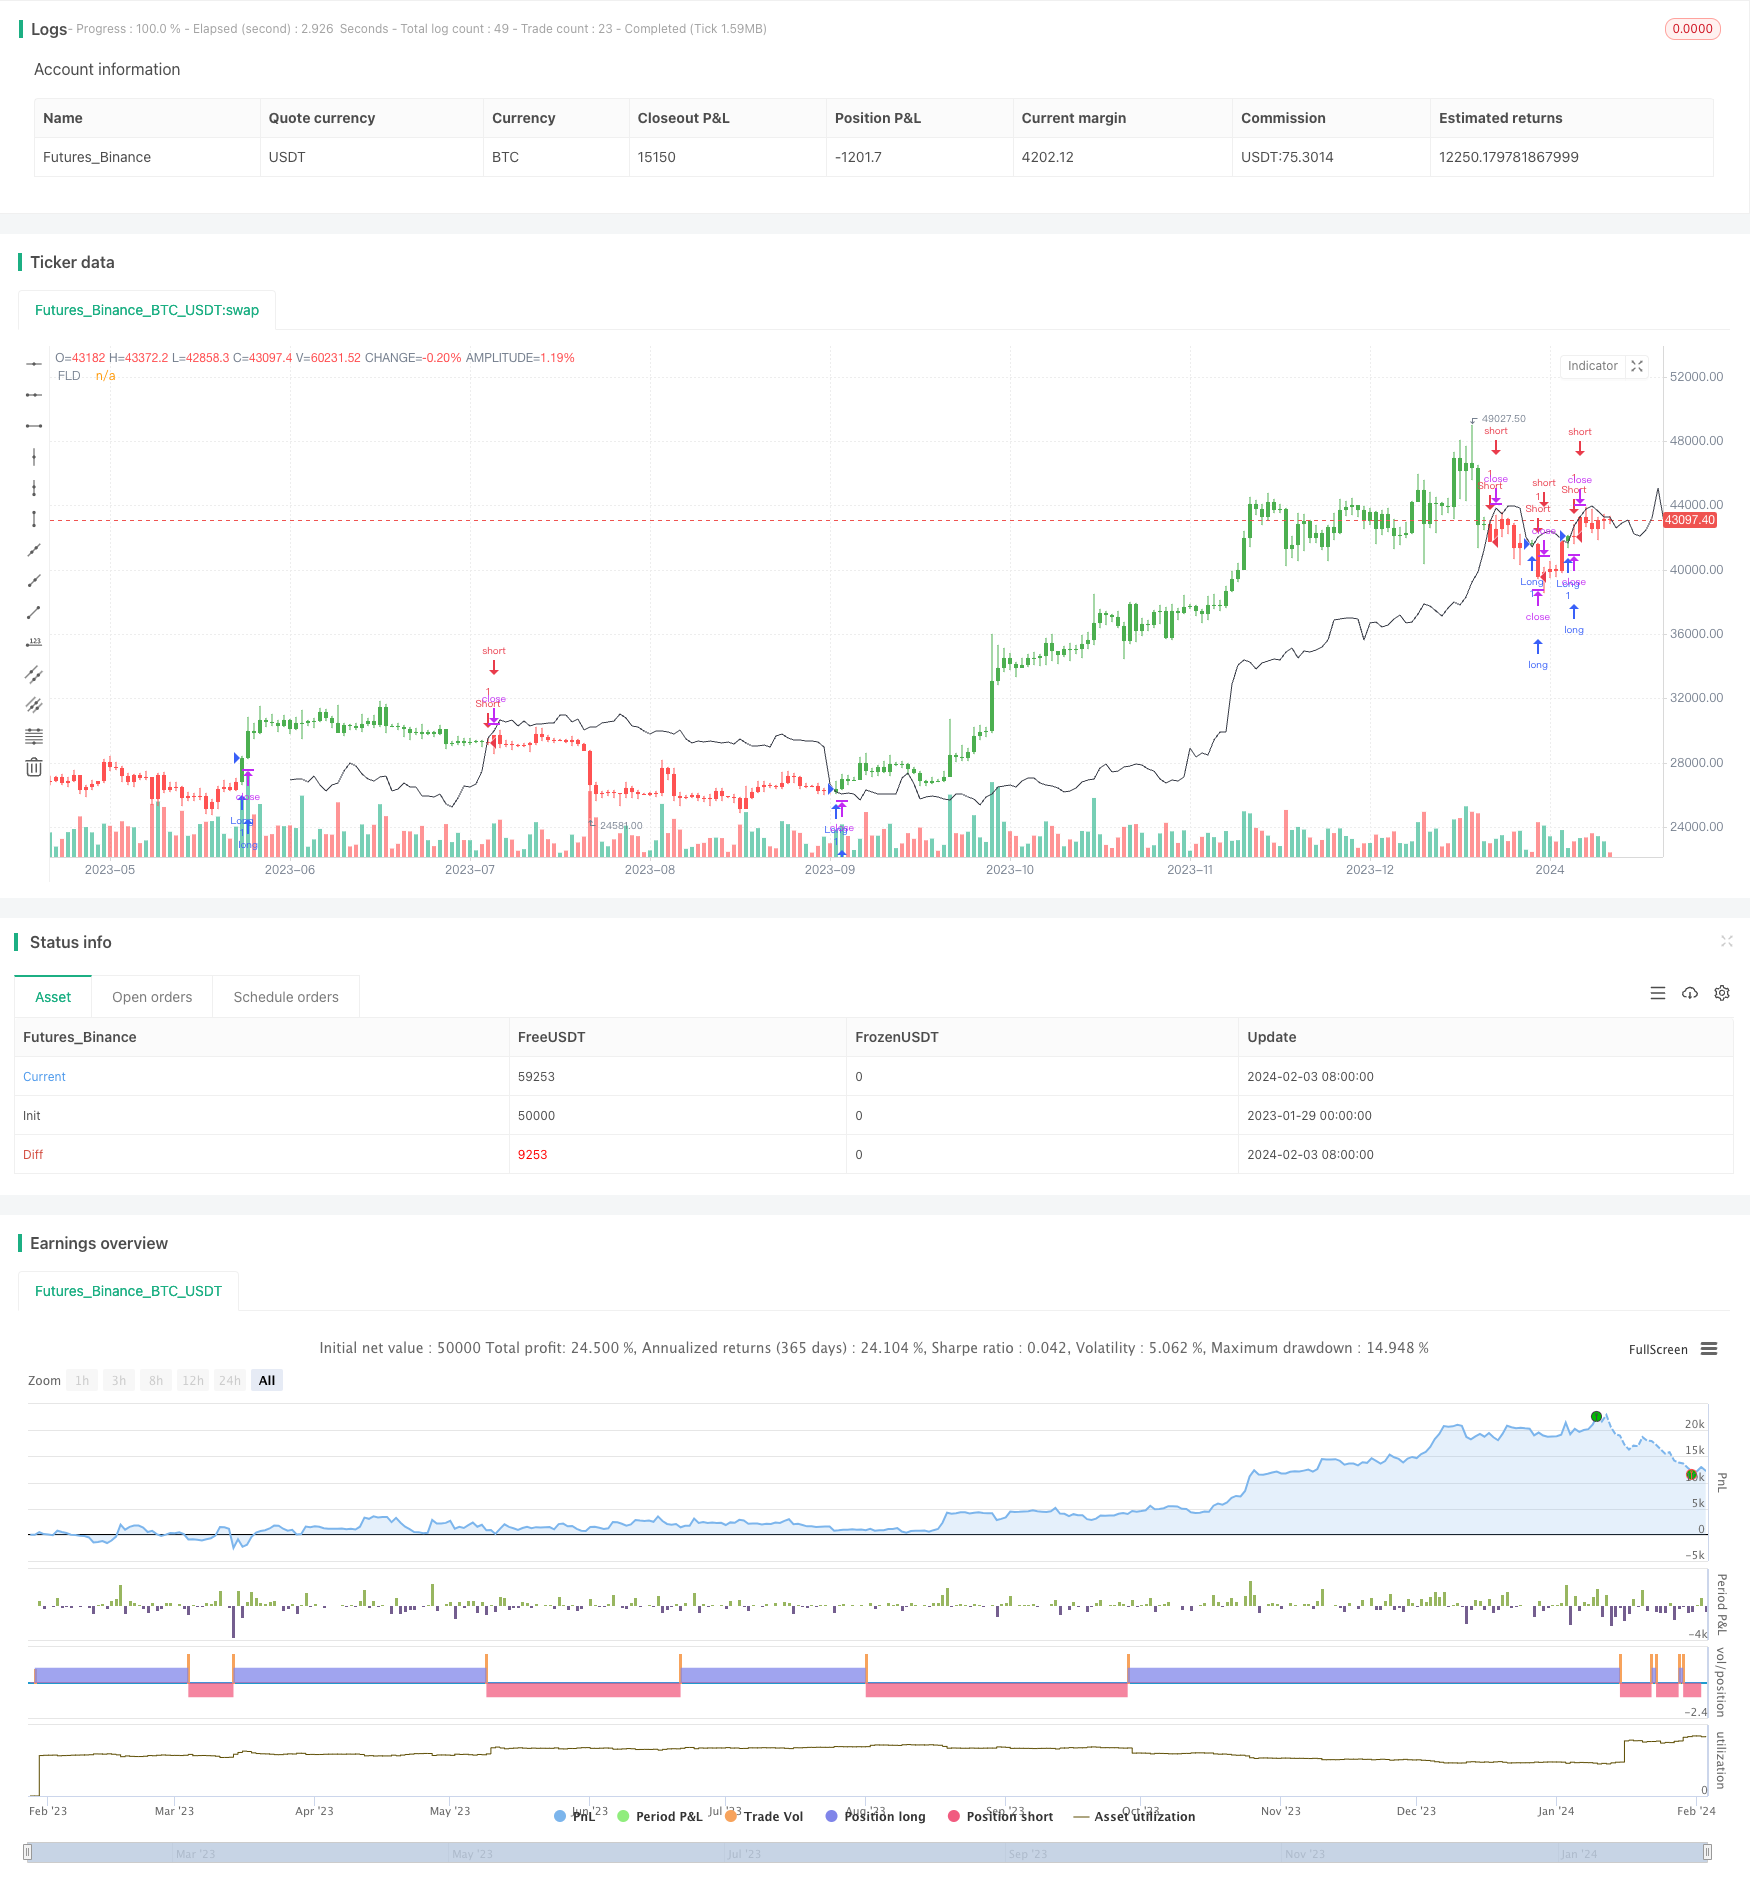
A principal ideia da estratégia é determinar a direção do preço futuro, traçando uma linha de extensão de preço futuro, e combinando a relação do preço atual com essa linha. Quando o preço está acima ou abaixo da linha de extensão, pode-se fazer mais ou menos.
Princípio da estratégia
As linhas de demarcação de preços futuros (FLD) representam o preço médio, o preço mais alto ou o preço mais baixo em um determinado período futuro. A estratégia usa o FLD para determinar o movimento futuro dos preços.
- De acordo com a duração do ciclo, calcule o período de deslocamento do FLD, ou seja, o preço futuro do preço.
- Compare o preço de fechamento atual com o preço após o período de deslocamento do FLD.
- Quando o preço de fechamento é inferior ao preço futuro do FLD, é considerado um sinal de otimismo.
- Quando o preço de fechamento é superior ao preço futuro do FLD, é considerado um sinal de baixa.
- De acordo com os sinais de alta e baixa, faça a correspondente operação de mais ou menos curto prazo.
Análise de vantagens
As principais vantagens desta estratégia são:
- O uso do FLD para determinar a movimentação futura dos preços tem uma alta taxa de precisão.
- Parâmetros de ciclo personalizáveis para diferentes ambientes de mercado.
- Pode ser escolhido o preço médio, o preço máximo ou o preço mínimo como fonte de mapeamento de FLD, sendo altamente adaptável.
Análise de Riscos
Os principais riscos desta estratégia são:
- O FLD em si pode falhar, causando oportunidades perdidas ou sinais errados. Pode ser julgado em combinação com outros indicadores.
- A configuração incorreta dos parâmetros de ciclo pode causar muitos sinais errados. É necessário otimizar a duração do ciclo.
- Eventos inesperados levam a uma forte oscilação de preços, e a previsão da FLD é inadequada. Pode-se definir um stop loss para controlar o risco.
Direção de otimização
A estratégia pode ser melhorada em:
- Combinado com outros indicadores de filtragem de sinais, aumenta a precisão da estratégia. Como MACD, KDJ, etc.
- Optimizar os parâmetros de ciclo para encontrar a melhor combinação de parâmetros.
- Aumentar o mecanismo de suspensão de prejuízos, controlando perdas e lucros individuais.
- De acordo com os resultados do teste de retorno, ajuste a regra de fazer mais espaço livre para reduzir os sinais errados.
Resumir
A estratégia é uma estratégia típica de acompanhamento de tendências, comparando o preço com a extensão futura do preço após o deslocamento. A lógica geral é clara e fácil de entender, e o risco de implementação é menor.
/*backtest
start: 2023-01-29 00:00:00
end: 2024-02-04 00:00:00
period: 1d
basePeriod: 1h
exchanges: [{"eid":"Futures_Binance","currency":"BTC_USDT"}]
*/

//@version=2
////////////////////////////////////////////////////////////////////
//  Copyright by HPotter v1.0 15/02/2017
//  An FLD is a line that is plotted on the same scale as the price and is in fact the
//  price itself displaced to the right (into the future) by (approximately) half the
//  wavelength of the cycle for which the FLD is plotted. There are three FLD's that can be
//  plotted for each cycle:
//    An FLD based on the median price.
//    An FLD based on the high price.
//    An FLD based on the low price.
///////////////////////////////////////////////////////////////////
strategy(title="FLD's - Future Lines of Demarcation", overlay=true)
Period = input(title="Period", defval=40)
src = input(title="Source", defval=hl2)
reverse = input(false, title="Trade reverse")
FLD = src
pos = iff(FLD[Period] < close , 1,
       iff(FLD[Period] > close, -1, nz(pos[1], 0)))
possig = iff(reverse and pos == 1, -1,
         iff(reverse and pos == -1, 1, pos))
if (possig == 1)
    strategy.entry("Long", strategy.long)
if (possig == -1)
    strategy.entry("Short", strategy.short)
barcolor(possig == -1 ? red: possig == 1 ? green : blue)
plot(FLD, title="FLD", style=line, linewidth=1, color=black, offset = Period)