Estratégia de caçador de tendências em vários períodos de tempo


Data de criação: 2024-02-18 10:17:06 última modificação: 2024-02-18 10:17:06
cópia: 0 Cliques: 681
1
focar em
1617
Seguidores

Estratégia de caçador de tendências em vários períodos de tempo

Visão geral

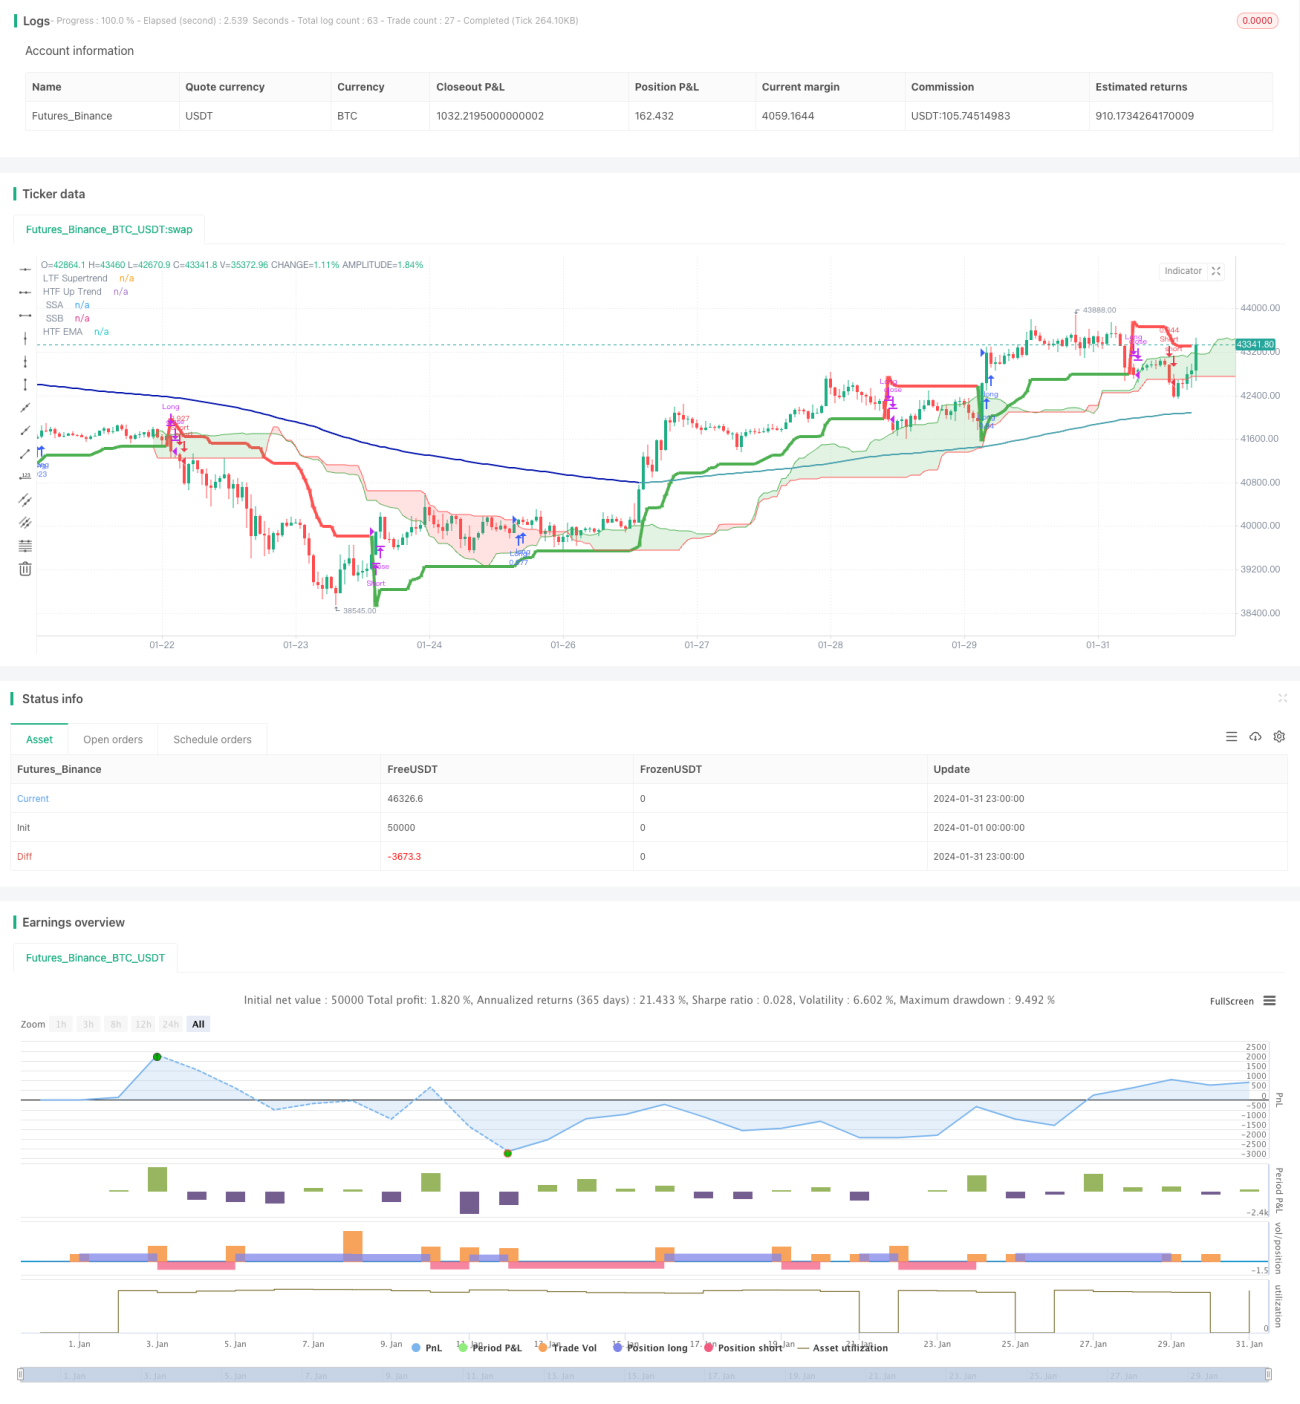
A estratégia de caçador de tendências de multi-marco de tempo é uma estratégia que utiliza vários indicadores em conjunto para realizar sinais de negociação automatizados. A estratégia combina o uso de médias móveis, indicadores de super tendências e indicadores de gráficos em nuvem, entre outros, para julgar a direção da tendência em vários períodos de tempo para descobrir potenciais oportunidades de negociação.

Princípio da estratégia

O princípio central da estratégia é julgar a direção da tendência em ambos os quadros de tempo. A estratégia primeiro calcula a média móvel, a linha de tendência super e a linha de conversão, a linha de referência, etc. do gráfico de uma nuvem no quadro de tempo alto.

A estratégia gerará um sinal de compra ou venda depois de satisfazer certas condições. O usuário pode escolher se deseja negociar apenas a ordem longa, a ordem curta ou ambas, de acordo com suas necessidades. Além disso, o usuário também pode configurar parâmetros de média móvel, parâmetros de super tendência, parâmetros de gráfico em nuvem, etc., para otimizar o desempenho da estratégia.

Análise de vantagens

A maior vantagem da estratégia reside na combinação de múltiplos prazos e múltiplos indicadores, o que pode aumentar significativamente a precisão na determinação da direção da tendência e detectar oportunidades de reversão em tempo hábil. As vantagens específicas são as seguintes:

  1. Utilize os prazos de alta e baixa para confirmar tendências e evitar ser enganado pelo ruído do mercado
  2. As médias móveis como indicadores de linha média e longa para determinar a direção das principais tendências
  3. Superlinhas de tendência como indicadores de curto prazo para capturar a reversão da tendência
  4. Um mapa de nuvem para avaliar áreas de resistência e identificar potenciais oportunidades

Análise de Riscos

O principal risco desta estratégia é que a configuração inadequada dos parâmetros pode levar a negociações excessivamente frequentes ou oportunidades perdidas. Além disso, o indicador emite um sinal errado que também pode causar perdas. Os riscos específicos e soluções são os seguintes:

  1. Risco de configuração de parâmetros: teste e otimize muito para encontrar a melhor combinação de parâmetros
  2. Risco de falha de sinal: verifique em conjunto com mais indicadores para evitar falhas de sinal
  3. Risco de retirada: ajuste adequado da gestão de posições e controle de perdas individuais

Direção de otimização

A estratégia ainda tem espaço para ser melhorada:

  1. Adicionar mais combinações de indicadores, como o Brinks, o RSI, etc., para melhorar a precisão do julgamento
  2. Modelos de aprendizado de máquina integrados para estratégias de negociação mais inteligentes
  3. Combinação de tecnologias de quantificação, como negociação em alta frequência, early bird, etc., para melhorar ainda mais o desempenho da estratégia
  4. Optimizar a estratégia de gestão de posições e reduzir o risco de retração através da adaptação dinâmica das posições

Resumir

Em suma, a estratégia de caçador de tendências de múltiplos quadros temporais usa vários indicadores e vários quadros temporais para avaliar as tendências e aproveitar as oportunidades de reversão em tempo hábil. É uma estratégia de negociação quantitativa de alto desempenho. A estratégia é altamente integrada e amplamente utilizada.

Código-fonte da estratégia
/*backtest
start: 2024-01-01 00:00:00
end: 2024-01-31 23:59:59
period: 1h
basePeriod: 15m
exchanges: [{"eid":"Futures_Binance","currency":"BTC_USDT"}]
*/

// This Pine Script™ code is subject to the terms of the Mozilla Public License 2.0 at https://mozilla.org/MPL/2.0/
// © godzcopilot / blockybears

// Thanks to anthonyf50 for his MTF Ichimoku https://www.tradingview.com/script/Pw9cBFma/
// Thanks to KivancOzbilgic for his SuperTrend https://www.tradingview.com/script/r6dAP7yi/
// Thanks to ZenAndTheArtOfTrading / PineScriptMastery for their Higher Timeframe EMA https://www.tradingview.com/script/Vh3XG9sD-Higher-Timeframe-EMA/


//@version=5
strategy("TrendHunter [Blocky]", overlay=true, default_qty_type=strategy.percent_of_equity, default_qty_value=80, initial_capital=1000, pyramiding=0)

// ================
// Strategy Inputs
// ================

// Defines user inputs for configuring the strategy.

// Higher Time Frame Selection
HTF_TimeFrame = input.timeframe(title='Higher Time Frame', defval='60', group = '== Timeframe ==', tooltip = "Select Chart for standard functionality")

// Inputs for EMA
len     = input.int(title="EMA Length", defval=200, group ='== EMA ==')
col     = input.bool(title="Colour EMA", defval=true, group ='== EMA ==')

// SuperTrend
Periods = input(title='ATR Period', defval=10, group = '== Supertrend ==')
Multiplier = input.float(title='ATR Multiplier', step=0.1, defval=3.0, group = '== Supertrend ==')
Src = input.source(title='Source', defval=hl2, group = '== Supertrend ==')

// Ichimoku
conversionPeriods = input.int(9, minval=1, title='Conversion Line Periods', group = '== Ichimoku ==')
basePeriods = input.int(26, minval=1, title='Base Line Periods', group = '== Ichimoku ==')
laggingSpan2Periods = input.int(52, minval=1, title='Lagging Span 2 Periods', group = '== Ichimoku ==')
displacement = input.int(26, minval=1, title='Displacement', group = '== Ichimoku ==')

// Ichimoku Display Options
isActiveConversion = input(false, 'Conversion Line', group = '== Ichimoku ==', inline = 'lines1')
isActiveBase = input(false, 'Base Line', group = '== Ichimoku ==', inline = 'lines1')
isActiveLagging = input(false, 'Lagging Span', group = '== Ichimoku ==', inline = 'lines2')
isActiveCloud = input(true, 'Cloud', group = '== Ichimoku ==', inline = 'lines2')


// ================
// Strategy Options
// ================

bTable = input.bool(true, title='Trade Table', group='== Strategy Options ==', tooltip = "Show table that shows current selected options and trade trade entry parameters")

bLong = input.bool(true, title='Enter Longs', group='== Strategy Options ==', inline = 'LongShort')
bShort = input.bool(true, title='Enter Shorts', group='== Strategy Options ==', inline = 'LongShort', tooltip = "Filter long / short trade signals")

bPriceCloud = input.bool(true, title='Price outside cloud', group='== Strategy Options ==', inline='PriceCloud')
bPriceCloudBody = input.bool(false, title='Full Body', group='== Strategy Options ==', inline='PriceCloud', tooltip = 'Only trade when price action outside the cloud.\nLongs when price action above the cloud.\nShort when price action below the cloud')

bPriceEMA = input.bool(false, title='Price above/below EMA', group='== Strategy Options ==', inline='PriceEMA')
bPriceEMABody = input.bool(false, title='Full Body', group='== Strategy Options ==', inline='PriceEMA', tooltip = 'Longs when price action above the EMA.\nShort when price action below the EMA')

bSuper = input.bool(true, title='Supertrend transistions', group='== Strategy Options ==', tooltip = "Trade in direction of the supertrend transitions")
bLTF = input.bool(false, title='LTF/HTF Supertrend alignment', group='== Strategy Options ==', tooltip = "Utilise a dual supertrends, chart and defined higher time frame")

bEMACloud1 = input.bool(true, title='EMA Outside Cloud', group='== Strategy Options ==', tooltip = "EMA must be outside the ichimoku cloud")
bEMACloud2 = input.bool(false, title='EMA above/below Cloud', group='== Strategy Options ==', tooltip = "Longs when EMA above the cloud.\nShort when EMA below the cloud")

bExitHTFTrail = input.bool(true, title='Super Trend Exits:  HTF', group='== Strategy Options ==', inline = 'Exits')
bExitLTFTrail = input.bool(true, title='LTF', group='== Strategy Options ==', inline = 'Exits', tooltip = 'Exit trades when price crosses the supertrend line\nIf neither selected trade closes when opposite trade opens\nIf using LTF closes turn on HTF/LTF alignment')

// ===========================
// EMA Functions and Plotting
// ===========================

// Calculate EMA
ema = ta.ema(close, len)
emaSmooth = request.security(syminfo.tickerid, HTF_TimeFrame, ema[barstate.isrealtime ? 1 : 0], gaps=barmerge.gaps_on)[barstate.isrealtime ? 0 : 1]


// Draw EMA
plot(emaSmooth, color=col ? (close > emaSmooth ? color.rgb(76, 163, 175) : color.rgb(6, 23, 173)) : color.black, linewidth=2, title="HTF EMA")


// ==================================
// Supertrend Functions and Plotting
// ==================================

// Function to calculate SuperTrend
calcSuperTrend(src, atrPeriods, multiplier) =>
    atr = ta.atr(atrPeriods)
    up = src - multiplier * atr
    up1 = nz(up[1], up)
    up := close[1] > up1 ? math.max(up, up1) : up
    dn = src + multiplier * atr
    dn1 = nz(dn[1], dn)
    dn := close[1] < dn1 ? math.min(dn, dn1) : dn
    trend = 1
    trend := nz(trend[1], trend)
    trend := trend == -1 and close > dn1 ? 1 : trend == 1 and close < up1 ? -1 : trend
    [up, dn, trend]

// Calculate SuperTrend for the current time frame
[up, dn, trend] = calcSuperTrend(Src, Periods, Multiplier)

// Plotting for the current time frame
plot(trend == 1 ? up : dn, title='LTF Supertrend', color=trend == 1 ?color.green : color.red, linewidth=1, style = plot.style_stepline)

// Fetching the higher time frame data
[HTF_up, HTF_dn, HTF_trend] = request.security(syminfo.tickerid, HTF_TimeFrame, calcSuperTrend(hl2, Periods, Multiplier), lookahead=barmerge.lookahead_on)

// Plotting for the higher time frame
plot(HTF_trend == 1 ? HTF_up : HTF_dn, title='HTF Up Trend', color= HTF_trend == 1 ? color.green : color.red, linewidth=4)


// ===============================
// Ichimoku Functions and Plotting
// ===============================

// Function to convert timeframe to hours
f_convertTimeframeToHours(tf) =>
    val = 0.0
    if tf == "1S" or tf == "S"
        val := 1.0 / 3600.0
    else if str.contains(tf, "S")
        val := str.tonumber(str.replace(tf, "S", "")) / 3600.0
    else if tf == "1D" or tf == "D"
        val := 24.0
    else if str.contains(tf, "D")
        val := str.tonumber(str.replace(tf, "D", "")) * 24.0
    else if tf == "1W" or tf == "W"
        val := 24.0 * 7.0
    else if str.contains(tf, "W")
        val := str.tonumber(str.replace(tf, "W", "")) * 24.0 * 7.0
    else if tf == "1M" or tf == "M"
        val := 24.0 * 30.0  // Approximation for a month
    else if str.contains(tf, "M")
        val := str.tonumber(str.replace(tf, "M", "")) * 24.0 * 30.0  // Approximation for months
    else
        // Default to minutes
        val := str.tonumber(tf) / 60.0
    val

// Time
timeOffset = time - time[1]


// Returns the displacement based on the chart / HTF resolution
f_getDisplacement(_res) =>
    _res == '' ? displacement : math.round(f_convertTimeframeToHours(_res) / f_convertTimeframeToHours(timeframe.period) * displacement)
    //f_avgDilationOf(_res) * displacement

// Returns average value between lowest and highest
f_avgLH(_len) =>
    math.avg(ta.lowest(_len), ta.highest(_len))

// Returns f_donchian data 
f_donchian(_tf, _src) =>
    request.security(syminfo.tickerid, _tf, _src, barmerge.gaps_off, barmerge.lookahead_on)

// Returns ichimoku data
f_ichimokuData(_tf) =>
    _isShow = _tf == '' or f_convertTimeframeToHours(_tf) >= f_convertTimeframeToHours(timeframe.period)
    _displacement = _isShow ? f_getDisplacement(_tf) : na
    _Conversion = _isShow ? f_donchian(_tf, f_avgLH(conversionPeriods)) : na
    _Base = _isShow ? f_donchian(_tf, f_avgLH(basePeriods)) : na
    _Lagging = _isShow ? f_donchian(_tf, close) : na
    _SSA = _isShow ? math.avg(_Conversion, _Base) : na
    _SSB = _isShow ? f_donchian(_tf, f_avgLH(laggingSpan2Periods)) : na
    _middleCloud = _isShow ? _SSA[0] > _SSB[0] ? _SSA[0] - math.abs(_SSA[0] - _SSB[0]) / 2 : _SSA[0] + math.abs(_SSA[0] - _SSB[0]) / 2 : na
    [_displacement, _Conversion, _Base, _Lagging, _SSA, _SSB, _middleCloud]

// Plotting ichimoku data

[Displacement, Conversion, Base, Lagging, SSA, SSB, fisrtMiddleCloud] = f_ichimokuData(HTF_TimeFrame)

// ————— Conversion
plot(isActiveConversion ? Conversion : na, color=color.new(color.blue, 0), title=' Conversion', linewidth=1)
// ————— Base
plot(isActiveBase ? Base : na, color=color.new(color.fuchsia, 0), title=' Base', linewidth=2)
// ————— Lagging
plot(isActiveLagging ? Lagging : na, offset=-Displacement, color=color.new(color.green, 0), title=' Lagging')

// ————— SSA + SSB
ssa = plot(isActiveCloud ? SSA : na, offset=Displacement, color=color.new(color.green, 0), title=' SSA', linewidth=1)
ssb = plot(isActiveCloud ? SSB : na, offset=Displacement, color=color.new(color.red, 0), title=' SSB', linewidth=1)
fill(ssa, ssb, color=color.new(SSA > SSB ? color.green : color.red , 80), title=' Cloud')


// ===============================
// Strategy Entries
// ===============================

// Checks whether price is inside the Ichimoku cloud
f_PriceCloud(dir) =>
    _enter = false
    if bPriceCloud
        if bLong and dir == 1
            if bPriceCloudBody
                _enter := close > math.max(SSA[Displacement], SSB[Displacement]) and open > math.max(SSA[Displacement], SSB[Displacement])
            else
                _enter := close > math.max(SSA[Displacement], SSB[Displacement])
        if bShort and dir == 2
            if bPriceCloudBody
                _enter := close < math.min(SSA[Displacement], SSB[Displacement]) and open < math.min(SSA[Displacement], SSB[Displacement])
            else
                _enter := close < math.min(SSA[Displacement], SSB[Displacement])
    else
        _enter := na
    _enter

// Checks whether price is above / below the ema
f_PriceEMA(dir) =>
    _enter = false
    if bPriceEMA
        if bLong and dir == 1
            if bPriceEMABody
                _enter := close > emaSmooth and open > emaSmooth
            else
                _enter := close > emaSmooth
        if bShort and dir == 2
            if bPriceEMABody
                _enter := close < emaSmooth and open < emaSmooth
            else
                _enter := close < emaSmooth
    else
        _enter := na
    _enter

// Checks HTF supertrend direction
f_Super(dir) =>
    _enter = false
    if bSuper
        if bLong and dir == 1
            _enter := HTF_trend == 1
        if bShort and dir == 2
            _enter := HTF_trend == -1
    else
        _enter := na

    _enter

// Checks LTF supertrend direction
f_LTF(dir) =>
    _enter = false
    if bLTF
        if bLong and dir == 1
            _enter := trend == 1 and HTF_trend == 1
        if bShort and dir == 2
            _enter := trend == -1 and HTF_trend == -1
    else
        _enter := na
    _enter

// Checks whether ema is inside the Ichimoku cloud
f_EMACloud1(dir) =>
    _enter = false
    if bEMACloud1
        if bLong and dir == 1
            _enter := (emaSmooth > math.max(SSA[Displacement], SSB[Displacement])) or (emaSmooth < math.min(SSA[Displacement], SSB[Displacement]))
        if bShort and dir == 2
            _enter := (emaSmooth > math.max(SSA[Displacement], SSB[Displacement])) or (emaSmooth < math.min(SSA[Displacement], SSB[Displacement]))
    else
        _enter := na
    _enter

// Checks whether ema is above/below Ichimoku cloud
f_EMACloud2(dir) =>
    _enter = false
    if bEMACloud2
        if bLong and dir == 1
            _enter := emaSmooth > math.max(SSA[Displacement], SSB[Displacement])
        if bShort and dir == 2
            _enter := emaSmooth < math.min(SSA[Displacement], SSB[Displacement])
    else
        _enter := na
    _enter

// Check if a value is 'na' or true.
f_NATrue(val) =>
    _enter = false
    if na(val)
        _enter := true
    if val
        _enter := true
    _enter   
    

// Consolidates entry conditions.
f_checkCondition(dir) =>
    _enter = false
    if na(f_PriceCloud(dir)) and na(f_PriceEMA(dir)) and na(f_Super(dir)) and na(f_LTF(dir)) and na(f_EMACloud1(dir)) and na(f_EMACloud2(dir))
        _enter := false
    else if f_NATrue(f_PriceCloud(dir)) and f_NATrue(f_PriceEMA(dir)) and f_NATrue(f_Super(dir)) and f_NATrue(f_LTF(dir)) and f_NATrue(f_EMACloud1(dir)) and f_NATrue(f_EMACloud2(dir))
        _enter := true
    _enter

        
// Execute long trade entries
longCondition = bLong and f_checkCondition(1)
if (longCondition)
    strategy.entry("Long", strategy.long)

// Execute short trade entries
shortCondition = bShort and f_checkCondition(2)
if (shortCondition)
    strategy.entry("Short", strategy.short)

// Excute trade exits
exitLong = (bExitHTFTrail and (close < HTF_up or HTF_trend == -1)) or (bExitLTFTrail and (close < up or trend == -1)) 
exitShort = (bExitHTFTrail and (close > HTF_dn or HTF_trend == 1)) or (bExitLTFTrail and (close > dn or trend == 1)) 

if exitLong
    strategy.close("Long")

if exitShort
    strategy.close("Short")

// Creates a table shoing all the user options and their current status for entering a trade
if bTable
    // Create a table
    tbl = table.new(position = position.bottom_right, columns = 4, rows = 9, bgcolor=color.new(color.white, 50), border_width = 1)

    table.cell(tbl, 1, 0, "Selected")
    table.cell(tbl, 2, 0, "Long", bgcolor=na(bLong) ? color.gray : bShort ? color.rgb(4, 112, 8) : color.rgb(100, 7, 7))
    table.cell(tbl, 3, 0, "Short", bgcolor=na(bShort) ? color.gray : bShort ? color.rgb(4, 112, 8) : color.rgb(100, 7, 7))

    table.cell(tbl, 0, 1, "Entry")
    table.cell(tbl, 2, 1, str.tostring(longCondition), bgcolor=longCondition ? color.green : color.red)
    table.cell(tbl, 3, 1, str.tostring(shortCondition), bgcolor=shortCondition ? color.green : color.red)


    table.cell(tbl, 0, 3, "Price Cloud")
    table.cell(tbl, 1, 3, str.tostring(bPriceCloud), bgcolor=na(bPriceCloud) ? color.gray : bPriceCloud ? color.green : color.red)
    table.cell(tbl, 2, 3, str.tostring(f_PriceCloud(1)), bgcolor=na(f_PriceCloud(1)) ? color.gray : f_PriceCloud(1) ? color.green : color.red)
    table.cell(tbl, 3, 3, str.tostring(f_PriceCloud(2)), bgcolor=na(f_PriceCloud(2)) ? color.gray : f_PriceCloud(2) ? color.green : color.red)

    table.cell(tbl, 0, 4, "Price EMA")
    table.cell(tbl, 1, 4, str.tostring(bPriceEMA), bgcolor=na(bPriceEMA) ? color.gray : bPriceEMA ? color.green : color.red)
    table.cell(tbl, 2, 4, str.tostring(f_PriceEMA(1)), bgcolor=na(f_PriceEMA(1)) ? color.gray : f_PriceEMA(1) ? color.green : color.red)
    table.cell(tbl, 3, 4, str.tostring(f_PriceEMA(2)), bgcolor=na(f_PriceEMA(2)) ? color.gray : f_PriceEMA(2) ? color.green : color.red)

    table.cell(tbl, 0, 5, "SuperTrend")
    table.cell(tbl, 1, 5, str.tostring(bSuper), bgcolor=na(bSuper) ? color.gray : bSuper ? color.green : color.red)
    table.cell(tbl, 2, 5, str.tostring(f_Super(1)), bgcolor=na(f_Super(1)) ? color.gray : f_Super(1) ? color.green : color.red)
    table.cell(tbl, 3, 5, str.tostring(f_Super(2)), bgcolor=na(f_Super(2)) ? color.gray : f_Super(2) ? color.green : color.red)

    table.cell(tbl, 0, 6, "HTF/LTF")
    table.cell(tbl, 1, 6, str.tostring(bLTF), bgcolor=na(bLTF) ? color.gray : bLTF ? color.green : color.red)
    table.cell(tbl, 2, 6, str.tostring(f_LTF(1)), bgcolor=na(f_LTF(1)) ? color.gray : f_LTF(1) ? color.green : color.red)
    table.cell(tbl, 3, 6, str.tostring(f_LTF(2)), bgcolor=na(f_LTF(2)) ? color.gray : f_LTF(2) ? color.green : color.red)

    table.cell(tbl, 0, 7, "EMA Outside Cloud")
    table.cell(tbl, 1, 7, str.tostring(bEMACloud1), bgcolor=na(bEMACloud1) ? color.gray : bEMACloud1 ? color.green : color.red)
    table.cell(tbl, 2, 7, str.tostring(f_EMACloud1(1)), bgcolor=na(f_EMACloud1(1)) ? color.gray : f_EMACloud1(1) ? color.green : color.red)
    table.cell(tbl, 3, 7, str.tostring(f_EMACloud1(2)), bgcolor=na(f_EMACloud1(2)) ? color.gray : f_EMACloud1(2) ? color.green : color.red)

    table.cell(tbl, 0, 8, "EMA Above/Below Cloud")
    table.cell(tbl, 1, 8, str.tostring(bEMACloud2), bgcolor=na(bEMACloud2) ? color.gray : bEMACloud2 ? color.green : color.red)
    table.cell(tbl, 2, 8, str.tostring(f_EMACloud2(1)), bgcolor=na(f_EMACloud2(1)) ? color.gray : f_EMACloud2(1) ? color.green : color.red)
    table.cell(tbl, 3, 8, str.tostring(f_EMACloud2(2)), bgcolor=na(f_EMACloud2(2)) ? color.gray : f_EMACloud2(2) ? color.green : color.red)