
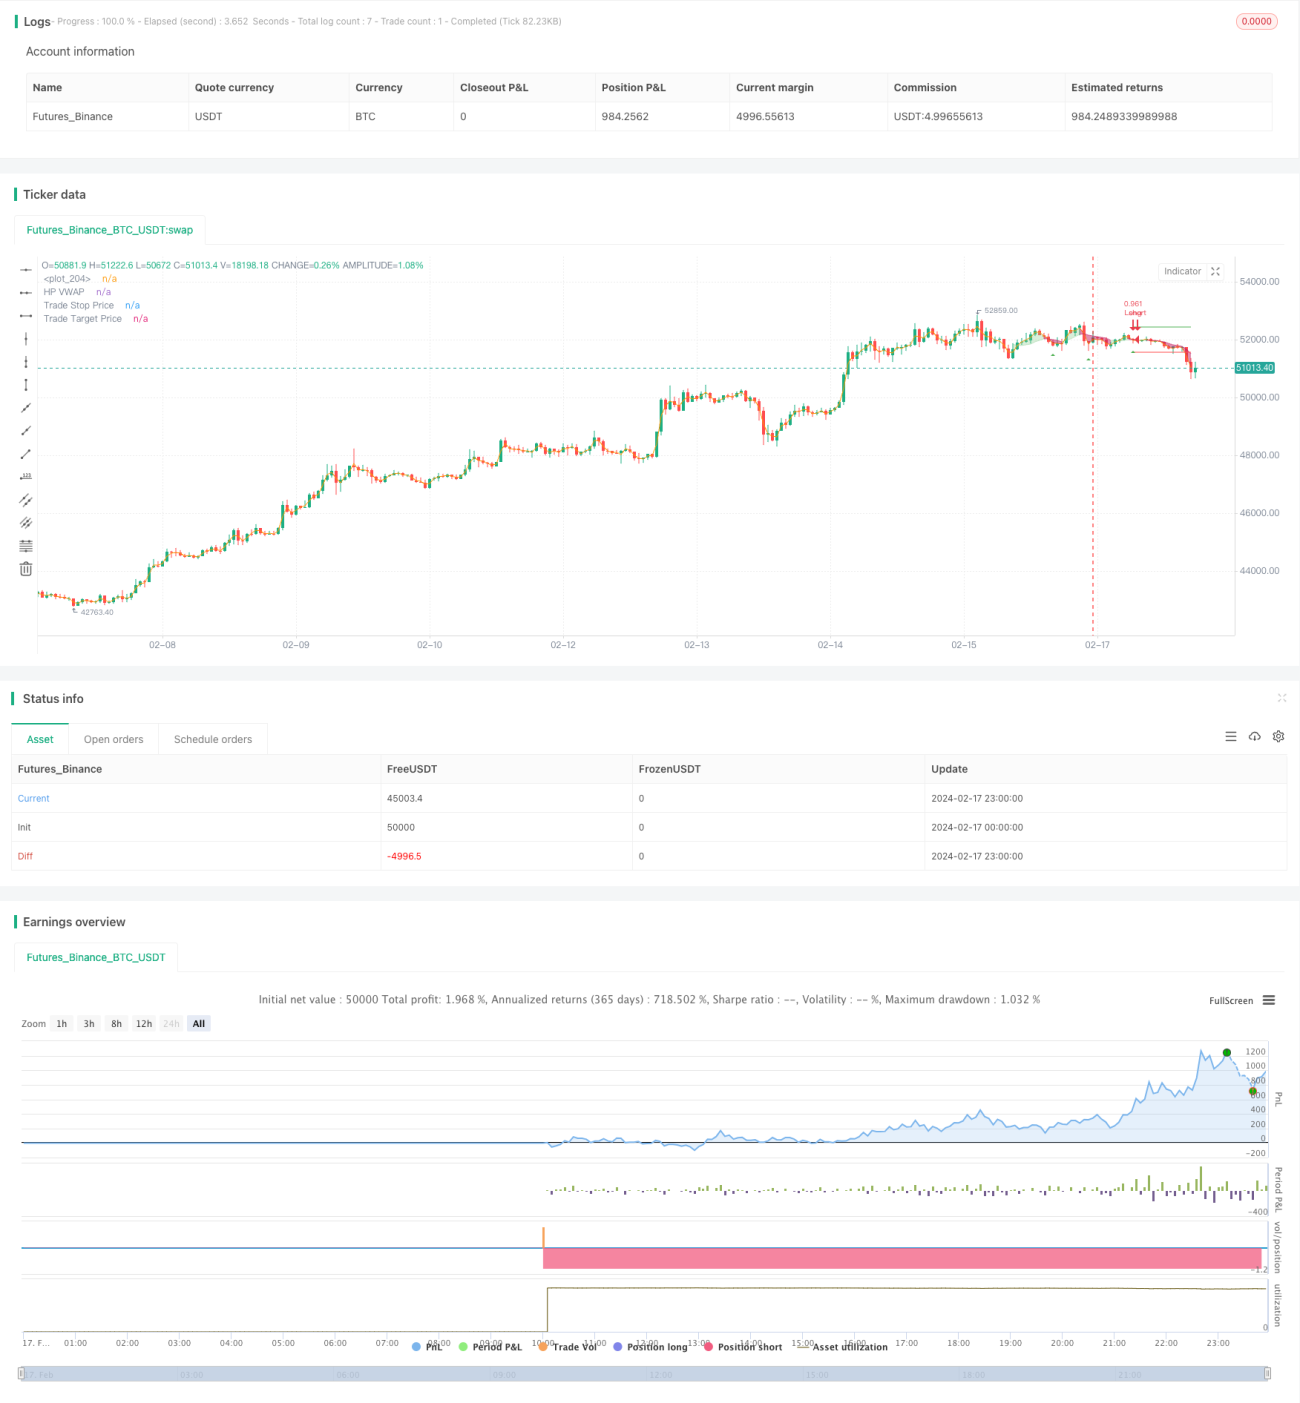
A estratégia usa o filtro Hodrick-Prescott, HP para suavizar o preço, extrair a linha de tendência do preço. Em seguida, computa um preço médio ponderado personalizado baseado no intervalo de tempo definido pelo usuário.
O filtro HP extrai as linhas de tendência dos preços. O filtro HP extrai os componentes de tendência de longo prazo dos preços por meio de métodos de otimização, excluindo interferências de flutuação de curto prazo.
O VWAP é calculado com base no intervalo de tempo personalizado pelo usuário. O VWAP pode refletir com mais precisão o preço médio em diferentes períodos.
Quando o preço está acima da linha de tendência da HP, é cumprida a condição de fazer mais; quando o preço está abaixo da linha de tendência da HP, é cumprida a condição de fazer menos. Assim, pode-se capturar a ruptura do preço de baixo para cima ou a ruptura do preço de cima para baixo.
ATR Stop loss combinado com assumir riscos razoáveis para evitar perdas excessivas.
O uso de filtros HP para extrair a tendência dos preços é mais suave em comparação com indicadores como o MA, evitando ser enganado por flutuações de preços de curto prazo.
Capacidade de personalizar o ciclo VWAP, com maior flexibilidade para adaptar-se às mudanças do ciclo de mercado.
A negociação de acordo com a direção da tendência, de acordo com a filosofia de negociação da tendência, tem uma maior taxa de vitória.
ATR Stop Loss Controle de perdas individuais, evitando perdas excessivas.
Os vários parâmetros podem ser ajustados e otimizados para diferentes mercados.
Pode ocorrer um stop-loss frequente em uma colisão de disco de vibração. Pode-se liberar adequadamente a faixa de stop-loss.
No final da tendência, o ClientRawResponse geralmente apresenta brechas de detecção de retorno para que a estratégia seja encaixada. Deve ser combinado com outros indicadores para determinar o final da tendência e a liquidação oportuna.
A configuração incorreta do ciclo VWAP pode perder oportunidades de negociação mais eficazes. O ciclo VWAP deve ser ajustado com a dinâmica do indicador de tendência.
O parâmetro do filtro HP λ pode ajustar a intensidade de suavização. A linha de tendência do valor de λ é mais suave e mais propícia para capturar a tendência da linha longa; a hora de resposta do valor de λ é mais sensível às mudanças de preço e mais adequada para capturar a oportunidade da linha curta.
O multiplicador ATR pode ajustar o alcance de suspensão. Ele pode ser compatível com a otimização de parâmetros de λ, e os valores de λ podem ser apropriadamente ampliados para aumentar o alcance de suspensão. Os valores de λ podem ser reduzidos para bloquear mais lucros.
A taxa de retorno do risco ((R:R) afeta diretamente a taxa de ganho e perda. O controle de retirada e a lucratividade podem ser testados em diferentes circunstâncias multiplicativas.
A estratégia em geral adota o design da estratégia de acompanhamento de tendências. Através de várias configurações de parâmetros, pode ser otimizado para diferentes períodos de tempo, de longo e curto, com alta taxa de vitória e rentabilidade. O controle de risco também é considerado para garantir que os perdas individuais não sejam excessivos.
/*backtest
start: 2024-02-17 00:00:00
end: 2024-02-18 00:00:00
period: 1h
basePeriod: 15m
exchanges: [{"eid":"Futures_Binance","currency":"BTC_USDT"}]
*/
// This source code is subject to the terms of the Mozilla Public License 2.0 at https://mozilla.org/MPL/2.0/
// © tathal animouse hajixde
//@version=4
strategy("LPB MicroCycles Strategy", "HPVWAP", overlay=true, default_qty_type=strategy.percent_of_equity, default_qty_value=100, max_bars_back=5000)
startDate = input(title="Start Date", type=input.integer,
defval=1, minval=1, maxval=31)
startMonth = input(title="Start Month", type=input.integer,
defval=1, minval=1, maxval=12)
startYear = input(title="Start Year", type=input.integer,
defval=2010, minval=1800, maxval=2100)
endDate = input(title="End Date", type=input.integer,
defval=31, minval=1, maxval=31)
endMonth = input(title="End Month", type=input.integer,
defval=12, minval=1, maxval=12)
endYear = input(title="End Year", type=input.integer,
defval=2021, minval=1800, maxval=2100)
// STEP 2:
// Look if the close time of the current bar
// falls inside the date range
inDateRange = true
///
// Strategy Settings
var g_strategy = "Strategy Settings"
stopMultiplier = input(title="Stop Loss ATR", type=input.float, defval=1.0, group=g_strategy, tooltip="Stop loss multiplier (x ATR)")
rr = input(title="R:R", type=input.float, defval=1.0, group=g_strategy, tooltip="Risk:Reward profile")
/// Backtester Settings
var g_tester = "Backtester Settings"
startBalance = input(title="Starting Balance", type=input.float, defval=10000.0, group=g_tester, tooltip="Your starting balance for the custom inbuilt tester system")
riskPerTrade = input(title="Risk Per Trade", type=input.float, defval=1.0, group=g_tester, tooltip="Your desired % risk per trade (as a whole number)")
drawTester = input(title="Draw Backtester", type=input.bool, defval=true, group=g_tester, tooltip="Turn on/off inbuilt backtester display")
////////////////INPUTS///////////////////
lambda = input(defval = 1000, type = input.float, title = "Smoothing Factor (Lambda)", minval = 1)
leng = input(defval = 100, type = input.integer, title = "Filter Length", minval = 1)
src = ohlc4
atr = atr(14)
///////////Construct Arrays///////////////
a = array.new_float(leng, 0.0)
b = array.new_float(leng, 0.0)
c = array.new_float(leng, 0.0)
d = array.new_float(leng, 0.0)
e = array.new_float(leng, 0.0)
f = array.new_float(leng, 0.0)
/////////Initialize the Values///////////
ll1 = leng-1
ll2 = leng-2
for i = 0 to ll1
array.set(a,i, lambda*(-4))
array.set(b,i, src[i])
array.set(c,i, lambda*(-4))
array.set(d,i, lambda*6 + 1)
array.set(e,i, lambda)
array.set(f,i, lambda)
array.set(d, 0, lambda + 1.0)
array.set(d, ll1, lambda + 1.0)
array.set(d, 1, lambda * 5.0 + 1.0)
array.set(d, ll2, lambda * 5.0 + 1.0)
array.set(c, 0 , lambda * (-2.0))
array.set(c, ll2, lambda * (-2.0))
array.set(a, 0 , lambda * (-2.0))
array.set(a, ll2, lambda * (-2.0))
//////////////Solve the optimization issue/////////////////////
float r = array.get(a, 0)
float s = array.get(a, 1)
float t = array.get(e, 0)
float xmult = 0.0
for i = 1 to ll2
xmult := r / array.get(d, i-1)
array.set(d, i, array.get(d, i) - xmult * array.get(c, i-1))
array.set(c, i, array.get(c, i) - xmult * array.get(f, i-1))
array.set(b, i, array.get(b, i) - xmult * array.get(b, i-1))
xmult := t / array.get(d, i-1)
r := s - xmult*array.get(c, i-1)
array.set(d, i+1, array.get(d, i+1) - xmult * array.get(f, i-1))
array.set(b, i+1, array.get(b, i+1) - xmult * array.get(b, i-1))
s := array.get(a, i+1)
t := array.get(e, i)
xmult := r / array.get(d, ll2)
array.set(d, ll1, array.get(d, ll1) - xmult * array.get(c, ll2))
x = array.new_float(leng, 0)
array.set(x, ll1, (array.get(b, ll1) - xmult * array.get(b, ll2)) / array.get(d, ll1))
array.set(x, ll2, (array.get(b, ll2) - array.get(c, ll2) * array.get(x, ll1)) / array.get(d, ll2))
for j = 0 to leng-3
i = leng-3 - j
array.set(x, i, (array.get(b,i) - array.get(f,i)*array.get(x,i+2) - array.get(c,i)*array.get(x,i+1)) / array.get(d, i))
//////////////Construct the output///////////////////
HP = array.get(x,0)
///////////////Custom VWAP////////////////////////
TimeFrame = input('1', type=input.resolution)
start = security(syminfo.tickerid, TimeFrame, time)
//------------------------------------------------
newSession = iff(change(start), 1, 0)
//------------------------------------------------
vwapsum = 0.0
vwapsum := iff(newSession, HP*volume, vwapsum[1]+HP*volume)
volumesum = 0.0
volumesum := iff(newSession, volume, volumesum[1]+volume)
v2sum = 0.0
v2sum := iff(newSession, volume*HP*HP, v2sum[1]+volume*HP*HP)
myvwap = vwapsum/volumesum
dev = sqrt(max(v2sum/volumesum - myvwap*myvwap, 0))
Coloring=close>myvwap?color.new(#81c784, 62):color.new(#c2185b, 38)
av=myvwap
showBcol = input(true, type=input.bool, title="Show barcolors")
///////////////Entry & Exit///////////////////
// Custom function to convert pips into whole numbers
toWhole(number) =>
return = atr < 1.0 ? (number / syminfo.mintick) / (10 / syminfo.pointvalue) : number
return := atr >= 1.0 and atr < 100.0 and syminfo.currency == "JPY" ? return * 100 : return
// Custom function to convert whole numbers back into pips
toPips(number) =>
return = atr >= 1.0 ? number : (number * syminfo.mintick) * (10 / syminfo.pointvalue)
return := atr >= 1.0 and atr < 100.0 and syminfo.currency == "JPY" ? return / 100 : return
// Custom function to truncate (cut) excess decimal places
truncate(_number, _decimalPlaces) =>
_factor = pow(10, _decimalPlaces)
int(_number * _factor) / _factor
///////////////Conditional Strategy Logic//////////////
Long = crossover(av, ohlc4)
Sell = crossunder(av, ohlc4)
// Check if we have confirmation for our setup
validLong = Long and strategy.position_size == 0 and inDateRange and barstate.isconfirmed
validShort = Sell and strategy.position_size == 0 and inDateRange and barstate.isconfirmed
// Calculate our stop distance & size for the current bar
stopSize = atr * stopMultiplier
longStopPrice = low < low[1] ? low - stopSize : low[1] - stopSize
longStopDistance = close - longStopPrice
longTargetPrice = close + (longStopDistance * rr)
// Save trade stop & target & position size if a valid setup is detected
var t_entry = 0.0
var t_stop = 0.0
var t_target = 0.0
var t_direction = 0
// Detect valid long setups & trigger alert
if validLong
t_entry := close
t_stop := longStopPrice
t_target := longTargetPrice
t_direction := 1
strategy.entry(id="Long", long=strategy.long, when=validLong, comment="(SL=" + tostring(truncate(toWhole(longStopDistance),2)) + " pips)")
// Fire alerts
alert(message="Long Detected", freq=alert.freq_once_per_bar_close)
// Check if price has hit long stop loss or target
if t_direction == 1 and (low <= t_stop or high >= t_target)
t_direction := 0
// Check if price has hit short stop loss or target
if t_direction == -1 and (high >= t_stop or low <= t_target)
t_direction := 0
// Exit trades whenever our stop or target is hit
strategy.exit(id="Long Exit", from_entry="Long", limit=t_target, stop=t_stop, when=strategy.position_size > 0)
// Draw trade data
plot(strategy.position_size != 0 or validLong? t_stop : na, title="Trade Stop Price", color=color.red, style=plot.style_linebr)
plot(strategy.position_size != 0 or validLong? t_target : na, title="Trade Target Price", color=color.green, style=plot.style_linebr)
/////////////////////Plotting//////////////////////////
A=plot(av, color=Coloring, title="HP VWAP")
barcolor(showBcol?Coloring:na)
fill(A, plot(ohlc4), Coloring)
// Draw price action setup arrows
plotshape(validLong ? 1 : na, style=shape.triangleup, location=location.belowbar, color=color.green, title="Bullish Setup")
// // --- BEGIN TESTER CODE --- //
// // Declare performance tracking variables
// var balance = startBalance
// var drawdown = 0.0
// var maxDrawdown = 0.0
// var maxBalance = 0.0
// var totalPips = 0.0
// var totalWins = 0
// var totalLoss = 0
// // Detect winning trades
// if strategy.wintrades != strategy.wintrades[1]
// balance := balance + ((riskPerTrade / 100) * balance) * rr
// totalPips := totalPips + abs(t_entry - t_target)
// totalWins := totalWins + 1
// if balance > maxBalance
// maxBalance := balance
// // Detect losing trades
// if strategy.losstrades != strategy.losstrades[1]
// balance := balance - ((riskPerTrade / 100) * balance)
// totalPips := totalPips - abs(t_entry - t_stop)
// totalLoss := totalLoss + 1
// // Update drawdown
// drawdown := (balance / maxBalance) - 1
// if drawdown < maxDrawdown
// maxDrawdown := drawdown
// // Prepare stats table
// var table testTable = table.new(position.top_right, 5, 2, border_width=1)
// f_fillCell(_table, _column, _row, _title, _value, _bgcolor, _txtcolor) =>
// _cellText = _title + "\n" + _value
// table.cell(_table, _column, _row, _cellText, bgcolor=_bgcolor, text_color=_txtcolor)
// // Draw stats table
// var bgcolor = color.new(color.black,0)
// if drawTester
// if barstate.islastconfirmedhistory
// // Update table
// dollarReturn = balance - startBalance
// f_fillCell(testTable, 0, 0, "Total Trades:", tostring(strategy.closedtrades), bgcolor, color.white)
// f_fillCell(testTable, 0, 1, "Win Rate:", tostring(truncate((strategy.wintrades/strategy.closedtrades)*100,2)) + "%", bgcolor, color.white)
// f_fillCell(testTable, 1, 0, "Starting:", "$" + tostring(startBalance), bgcolor, color.white)
// f_fillCell(testTable, 1, 1, "Ending:", "$" + tostring(truncate(balance,2)), bgcolor, color.white)
// f_fillCell(testTable, 2, 0, "Return:", "$" + tostring(truncate(dollarReturn,2)), dollarReturn > 0 ? color.green : color.red, color.white)
// f_fillCell(testTable, 2, 1, "Pips:", (totalPips > 0 ? "+" : "") + tostring(truncate(toWhole(totalPips),2)), bgcolor, color.white)
// f_fillCell(testTable, 3, 0, "Return:", (dollarReturn > 0 ? "+" : "") + tostring(truncate((dollarReturn / startBalance)*100,2)) + "%", dollarReturn > 0 ? color.green : color.red, color.white)
// f_fillCell(testTable, 3, 1, "Max DD:", tostring(truncate(maxDrawdown*100,2)) + "%", color.red, color.white)
// // --- END TESTER CODE --- //