Estratégia de negociação de reversão de rompimento de canal

Visão geral
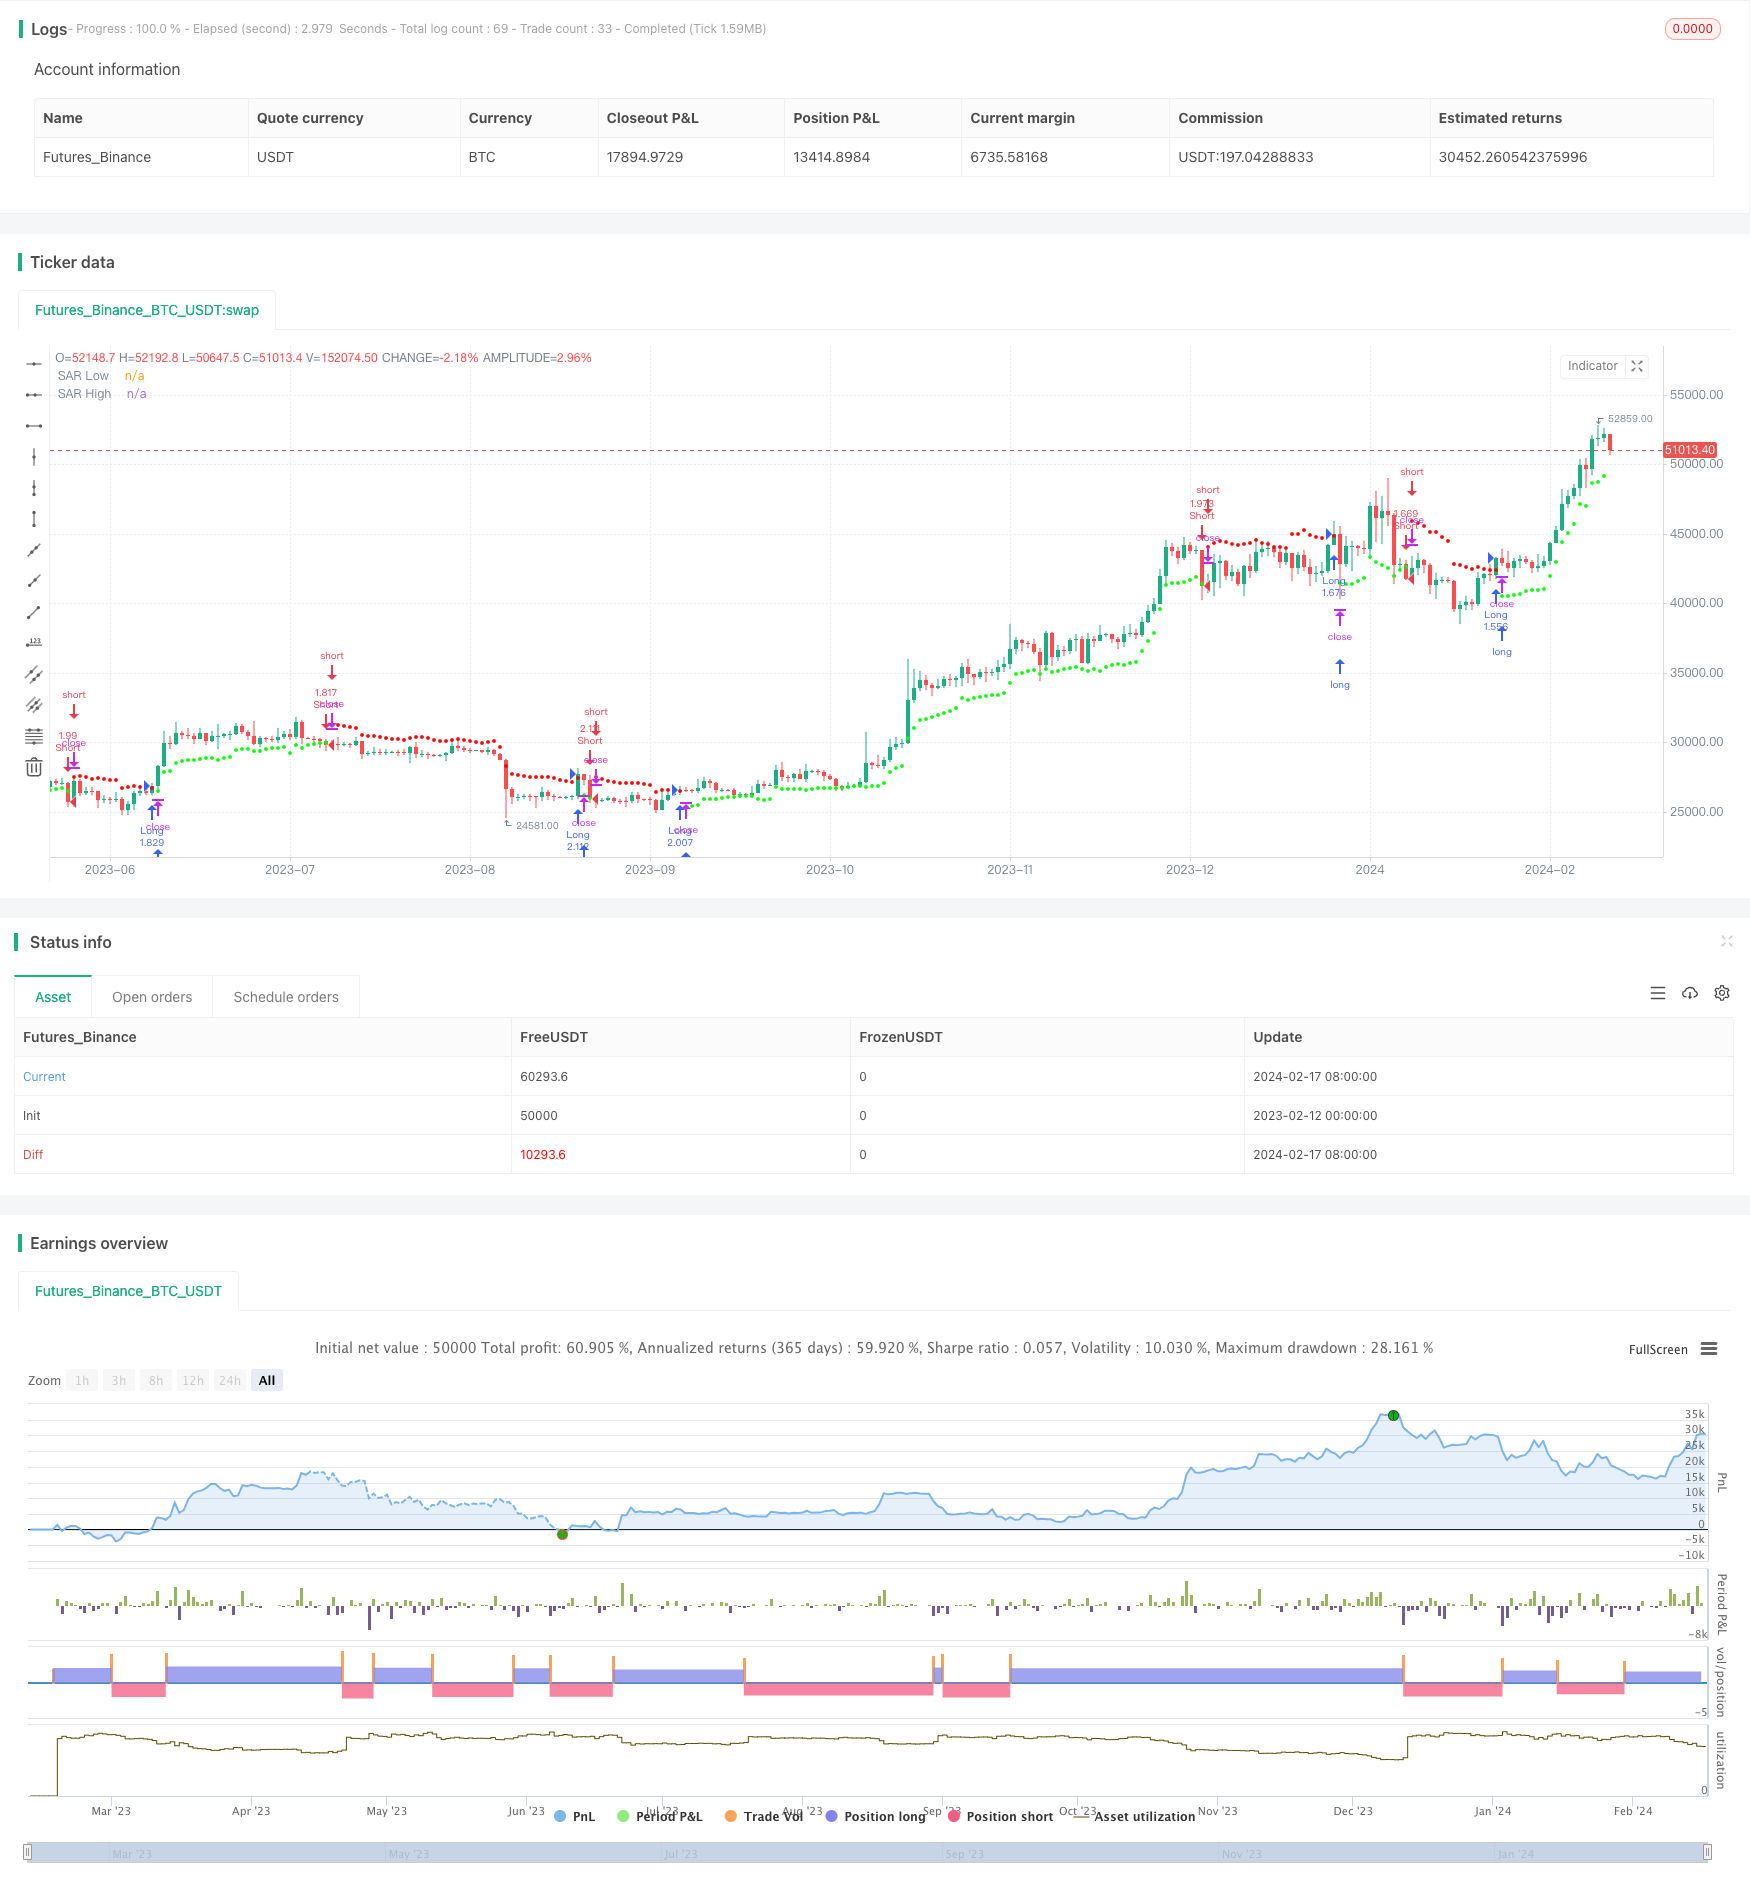
Uma estratégia de reversão de negociação de ruptura de canal é uma estratégia de negociação de reversão que segue o ponto de parada móvel do canal de preço. Ela usa o método de média móvel ponderada para calcular o canal de preço e estabelece posições a mais ou a zero quando o preço quebra o canal.
Princípio da estratégia
A estratégia primeiro calcula a taxa de flutuação do preço usando o indicador de alcance real médio de Wilder (ATR). Em seguida, calcula a constante de alcance médio (ARC) com base no valor do ATR. O ARC é a metade da largura do canal de preço.
Especificamente, primeiro calcule o ATR da linha N-K mais próxima. Em seguida, multiplique o ATR por um coeficiente para obter o ARC. O ARC multiplicado pelo coeficiente pode controlar a largura do canal. ARC adicionado ao ponto mais alto do preço de fechamento na linha N-K para obter o traçado do canal, ou seja, o SAR alto.
Vantagens estratégicas
- A utilização de um canal de adaptação para calcular a volatilidade dos preços permite acompanhar as mudanças no mercado.
- Negociação inversa, adequada para um mercado de tendência inversa
- Stop loss móvel, para bloquear lucros e controlar riscos
Risco estratégico
- A inversão de negociação é facilmente manipulada e requer ajustes apropriados nos parâmetros
- É fácil fechar posições em mercados altamente voláteis
- Parâmetros errados podem causar transações muito frequentes
Solução:
- Optimizar o ciclo ATR e o coeficiente ARC para racionalizar a largura do canal
- Filtragem de indicadores de tendência em combinação com o tempo de entrada
- Aumentar o ciclo de ATR e reduzir a frequência de transações
Direção de otimização da estratégia
- Optimizar o ciclo ATR e o coeficiente ARC
- Aumentar as condições de abertura de posição, por exemplo, com o indicador MACD
- Aumentar a estratégia de stop loss
Resumir
A estratégia de negociação de reversão de ruptura de canal usa o canal para rastrear as mudanças de preço, reestruturar as posições quando a volatilidade aumenta e definir um stop loss móvel adaptável. Esta estratégia é adequada para mercados de liquidação com reversão predominante e pode obter um bom retorno de investimento, desde que o ponto de reversão seja determinado com precisão.
/*backtest
start: 2023-02-12 00:00:00
end: 2024-02-18 00:00:00
period: 1d
basePeriod: 1h
exchanges: [{"eid":"Futures_Binance","currency":"BTC_USDT"}]
*/

//@version=3
//@author=LucF

// Volatility System [LucF]
// v1.0, 2019.04.14

// The Volatility System was created by Welles Wilder.
// It first appeared in his seminal masterpiece "New Concepts in Technical Trading Systems" (1978).
// He describes it on pp.23-26, in the chapter discussing the first presentation ever of the "Volatility Index",
// which later became known as ATR.
// Performance of the strategy usually increases with the time frame.
// Tuning of ATR length and, especially, the ARC factor, is key.

// This code runs as a strategy, which cannot generate alerts.
// If you want to use the alerts it must be converted to an indicator.
// To do so:
//      1. Swap the following 2 lines by commenting the first and uncommenting the second.
//      2. Comment out the last 4 lines containing the strategy() calls.
//      3. Save.
strategy(title="Volatility System by Wilder [LucF]", shorttitle="Volatility System [Strat]", overlay=true, precision=8, pyramiding=0, initial_capital=100000, default_qty_type=strategy.percent_of_equity, default_qty_value=100, commission_type=strategy.commission.percent, commission_value=0.1)
// study("Volatility System by Wilder [LucF]", shorttitle="Volatility System", precision=8, overlay=true)

// -------------- Colors
MyGreenRaw = color(#00FF00,0),      MyGreenMedium = color(#00FF00,50),  MyGreenDark = color(#00FF00,75),    MyGreenDarkDark = color(#00FF00,92)
MyRedRaw = color(#FF0000,0),        MyRedMedium = color(#FF0000,30),    MyRedDark = color(#FF0000,75),      MyRedDarkDark = color(#FF0000,90)

// -------------- Inputs
LongsOnly = input(false,"Longs only")
ShortsOnly = input(false,"Shorts only")
AtrLength = input(9, "ATR length", minval=2)
ArcFactor = input(1.8, "ARC factor", minval=0, type=float,step=0.1)
ShowSAR = input(false, "Show all SARs (Stop & Reverse)")
HideSAR = input(false, "Hide all SARs")
ShowTriggers = input(false, "Show Entry/Exit triggers")
ShowTradedBackground = input(false, "Show Traded Background")

FromYear  = input(defval = 2000,    title = "From Year", minval = 1900)
FromMonth = input(defval = 1,      title = "From Month", minval = 1, maxval = 12)
FromDay   = input(defval = 1,       title = "From Day", minval = 1, maxval = 31)
ToYear    = input(defval = 9999,    title = "To Year", minval = 1900)
ToMonth   = input(defval = 1,       title = "To Month", minval = 1, maxval = 12)
ToDay     = input(defval = 1,       title = "To Day", minval = 1, maxval = 31)

// -------------- Date range filtering
FromDate = timestamp(FromYear, FromMonth, FromDay, 00, 00)
ToDate = timestamp(ToYear, ToMonth, ToDay, 23, 59)
TradeDateIsAllowed() => true

// -------------- Calculate Stop & Reverse (SAR) points using Average Range Constant (ARC)
Arc   = atr(AtrLength)*ArcFactor
SarLo = highest(close, AtrLength)-Arc
SarHi = lowest(close, AtrLength)+Arc

// -------------- Entries/Exits
InLong = false
InShort = false
EnterLong = TradeDateIsAllowed() and not InLong[1] and crossover(close, SarHi[1])
EnterShort = TradeDateIsAllowed() and not InShort[1] and crossunder(close, SarLo[1])
InLong := (InLong[1] and not EnterShort[1]) or (EnterLong[1] and not ShortsOnly)
InShort := (InShort[1] and not EnterLong[1]) or (EnterShort[1] and not LongsOnly)

// -------------- Plots
// SAR points
plot( not HideSAR and ((InShort or EnterLong) or ShowSAR)? SarHi:na, color=MyRedMedium, style=circles, linewidth=2, title="SAR High")
plot( not HideSAR and ((InLong or EnterShort) or ShowSAR)? SarLo:na, color=MyGreenMedium, style=circles, linewidth=2, title="SAR Low")
// Entry/Exit markers
plotshape( ShowTriggers and not ShortsOnly and EnterLong, style=shape.triangleup, location=location.belowbar, color=MyGreenRaw, size=size.small, text="")
plotshape( ShowTriggers and not LongsOnly and EnterShort, style=shape.triangledown, location=location.abovebar, color=MyRedRaw, size=size.small, text="")
// Exits when printing only longs or shorts
plotshape( ShowTriggers and ShortsOnly and InShort[1] and EnterLong, style=shape.triangleup, location=location.belowbar, color=MyRedMedium, transp=70, size=size.small, text="")
plotshape( ShowTriggers and LongsOnly and InLong[1] and EnterShort, style=shape.triangledown, location=location.abovebar, color=MyGreenMedium, transp=70, size=size.small, text="")
// Background
bgcolor( color=ShowTradedBackground? InLong and not ShortsOnly?MyGreenDarkDark: InShort and not LongsOnly? MyRedDarkDark:na:na)

// ---------- Alerts
alertcondition( EnterLong or EnterShort, title="1. Reverse", message="Reverse")
alertcondition( EnterLong, title="2. Long", message="Long")
alertcondition( EnterShort, title="3. Short", message="Short")

// ---------- Strategy reversals
strategy.entry("Long", strategy.long, when=EnterLong and not ShortsOnly)
strategy.entry("Short", strategy.short, when=EnterShort  and not LongsOnly)
strategy.close("Short", when=EnterLong and ShortsOnly)
strategy.close("Long", when=EnterShort and LongsOnly)