Estratégias quantitativas baseadas em reversões de pontos de pivô
Visão geral
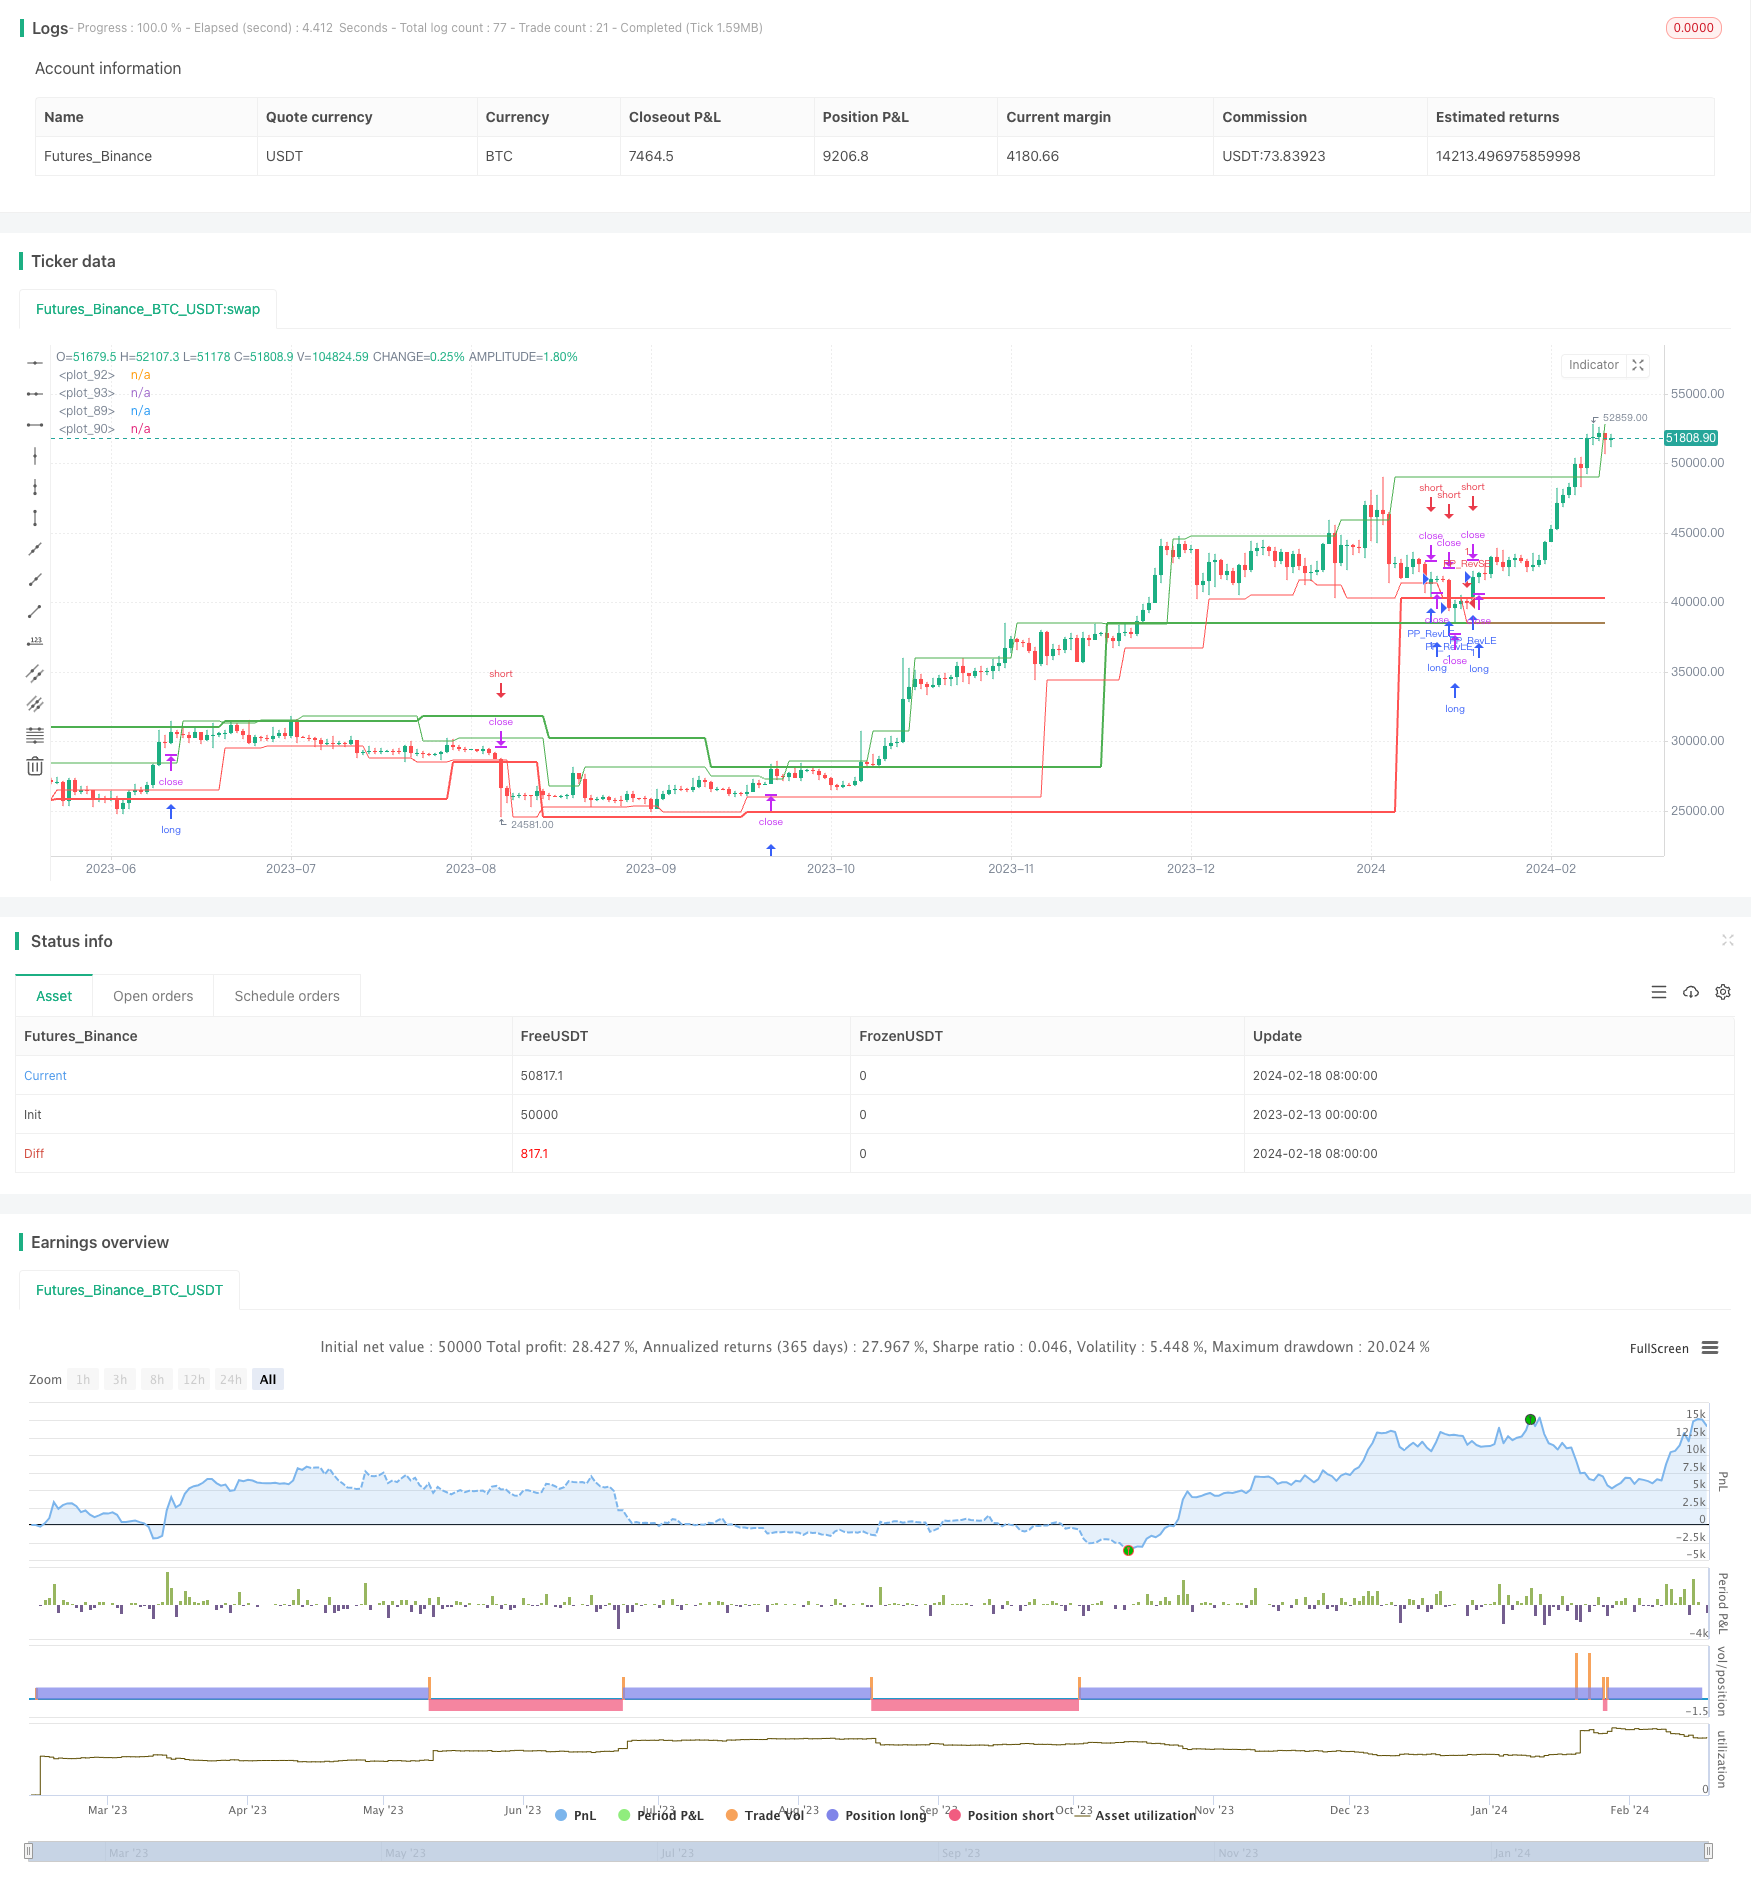
A ideia central desta estratégia é usar os pontos centrais para a negociação de quantidade. Busca por altos e baixos centrais importantes e reverte a negociação quando o preço ultrapassa esses pontos.
Princípio da estratégia
A estratégia define primeiro as funções pivotHighSig() e pivotLowSig() para encontrar os pontos altos e baixos do eixo central. Estas funções buscam os pontos altos e baixos do eixo central correspondentes tanto à esquerda como à direita.
Concretamente, para o ponto alto do eixo, ele procura vários pontos altos e baixos consecutivos à esquerda e à direita. Assim, o ponto alto do eixo está em uma posição relativamente mais alta. O critério do ponto baixo do eixo, ao contrário, procura pontos altos e baixos em ambos os lados da esquerda e da direita.
Depois de encontrar o ponto alto e baixo do eixo, a estratégia seleciona ainda mais o ponto central do eixo, ou seja, o ponto importante no eixo. Isso é possível através da definição de várias variáveis históricas do ponto alto e baixo do eixo, como ph1, ph2 e assim por diante.
Por fim, quando o preço ultrapassa o eixo central do eixo central, a reversão é feita.
Vantagens estratégicas
A estratégia de quantificação baseada em eixos tem as seguintes vantagens:
- Aproveitando as áreas de resistência de suporte no mercado, que são frequentemente pontos de oportunidade para a reversão de preços
- Ao mesmo tempo, encontrar altos e baixos significativos para a realização de transações bilaterais multi-espaço
- O ponto central é o extremum mais proeminente, onde o sinal é mais forte.
- Utilizando os eixos do eixo central para tornar o sinal mais confiável
Riscos e soluções
A estratégia também apresenta alguns riscos:
- A solução é ajustar os parâmetros de espaçamento para a direita e para a esquerda, para garantir que a identificação do eixo seja mais precisa.
- A solução é combinar mais fatores para filtrar o sinal, como a potência, o volume de transação, etc.
Direção de otimização
A estratégia também pode ser melhorada em várias direções:
- Aumentar a estratégia de stop loss para tornar a estratégia mais estável
- Filtragem de sinais com mais indicadores
- Desenvolver estratégias de inversão de PRED para otimizar ainda mais a previsão do eixo central com o uso de ML
- Adição de parâmetros de adaptação
Resumir
A estratégia, em geral, está funcionando bem, e a ideia central é encontrar os principais pilares e inverter a negociação em caso de ruptura. Com mais otimização, a estratégia pode obter sinais mais estáveis e confiáveis, resultando em bons resultados.
/*backtest
start: 2023-02-13 00:00:00
end: 2024-02-19 00:00:00
period: 1d
basePeriod: 1h
exchanges: [{"eid":"Futures_Binance","currency":"BTC_USDT"}]
*/

//@version=4
strategy("Pivot of Pivot Reversal Strategy [QuantNomad]", shorttitle = "PoP Reversal Strategy [QN]", overlay=true)

// Inputs
leftBars   = input(4,   title = 'PP Left Bars')
rightBars  = input(2,   title = 'PP Right Bars')
atr_length = input(14,  title = 'ATR Length')
atr_mult   = input(0.1, title = 'ATR Mult')

// Pivot High Significant Function
pivotHighSig(left, right) =>
    pp_ok = true
    atr   = atr(atr_length)

    for i = 1 to left
        if (high[right] < high[right+i] + atr * atr_mult)
            pp_ok := false
    for i = 0 to right-1
        if (high[right] < high[i] + atr * atr_mult)
            pp_ok := false

    pp_ok ? high[right] : na

// Pivot Low Significant Function
pivotLowSig(left, right) =>
    pp_ok = true
    atr   = atr(atr_length)

    for i = 1 to left
        if (low[right] > low[right+i] - atr * atr_mult)
            pp_ok := false
    for i = 0 to right-1
        if (low[right] > low[i] - atr * atr_mult)
            pp_ok := false

    pp_ok ? low[right] : na


swh = pivotHighSig(leftBars, rightBars)
swl = pivotLowSig (leftBars, rightBars)

swh_cond = not na(swh)

hprice = 0.0
hprice := swh_cond ? swh : hprice[1]

le = false
le := swh_cond ? true : (le[1] and high > hprice ? false : le[1])

swl_cond = not na(swl)

lprice = 0.0
lprice := swl_cond ? swl : lprice[1]

se = false
se := swl_cond ? true : (se[1] and low < lprice ? false : se[1])

// Pivots of pivots
ph1 = 0.0
ph2 = 0.0
ph3 = 0.0

pl1 = 0.0
pl2 = 0.0
pl3 = 0.0

pphprice = 0.0
pplprice = 0.0

ph3 := swh_cond ? nz(ph2[1]) : nz(ph3[1])
ph2 := swh_cond ? nz(ph1[1]) : nz(ph2[1])
ph1 := swh_cond ? hprice     : nz(ph1[1])

pl3 := swl_cond ? nz(pl2[1]) : nz(pl3[1])
pl2 := swl_cond ? nz(pl1[1]) : nz(pl2[1])
pl1 := swl_cond ? lprice     : nz(pl1[1])

pphprice := swh_cond and ph2 > ph1 and ph2 > ph3 ? ph2 : nz(pphprice[1])
pplprice := swl_cond and pl2 < pl1 and pl2 < pl3 ? pl2 : nz(pplprice[1])


if (le)
    strategy.entry("PP_RevLE", strategy.long, comment="PP_RevLE", stop=pphprice + syminfo.mintick)

if (se)
    strategy.entry("PP_RevSE", strategy.short, comment="PP_RevSE", stop=pplprice - syminfo.mintick)

// Plotting
plot(lprice, color = color.red,   transp = 55)
plot(hprice, color = color.green, transp = 55)

plot(pplprice, color = color.red,   transp = 0, linewidth = 2)
plot(pphprice, color = color.green, transp = 0, linewidth = 2)