Estratégia de acompanhamento de tendências com base na descoberta da regressão da média móvel

Visão geral
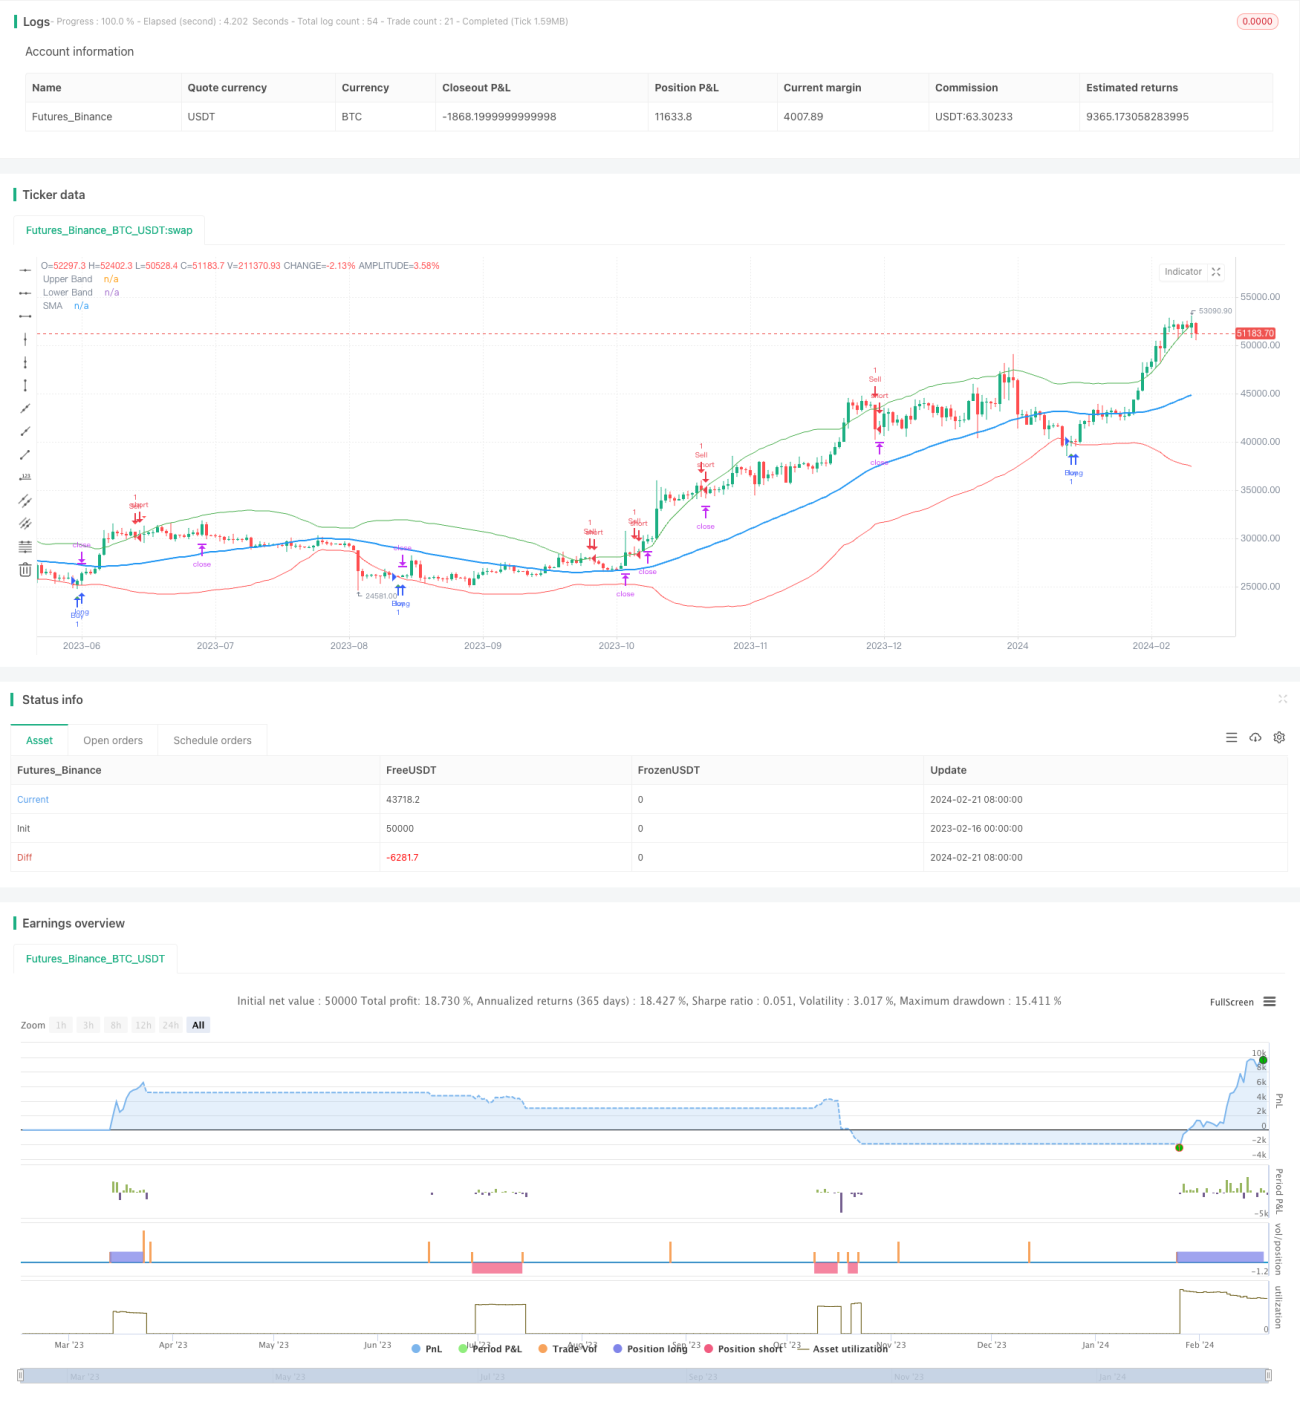
A estratégia de ruptura de retorno de linha média é uma estratégia de negociação quantitativa típica de acompanhamento de tendências. A estratégia usa a média móvel e seu canal de desvio padrão para julgar o movimento do mercado e gerar um sinal de negociação quando o preço quebra o canal de desvio padrão.
Princípio da estratégia
A estratégia primeiro calcula o SMA de uma média móvel simples de N dias (o padrão é 50 dias) e, em seguida, calcula o diferencial padrão para o preço do ciclo, StdDev, com base no SMA.
Depois de entrar no mercado, a estratégia configura um stop loss. Concretamente, depois de fazer mais, a linha de stop loss é a do preço de fechamento no momento da entrada ((100 - percentual de stop loss); depois de fechar, a linha de stop loss é a do preço de fechamento no momento da entrada ((100 + percentual de stop loss)).
Análise de vantagens
A estratégia tem as seguintes vantagens:
- A capacidade de acompanhamento de tendências é forte. O uso do canal de diferença padrão permite acompanhar dinamicamente as flutuações do mercado.
- Controle de retirada forte. O uso de stop loss móvel permite o controle efetivo de perdas individuais.
- Simples de implementar. Poupa-se uma grande quantidade de optimização de parâmetros e é muito fácil de implementar.
Análise de Riscos
A estratégia também apresenta alguns riscos:
- Risco de reversão de tendência. Estratégias de acompanhamento de tendência são propensas a sair com perdas e depois reverter.
- Risco sensível a parâmetros. A escolha de parâmetros com períodos de médias móveis e múltiplos de desvios padrão tem maior impacto na performance da estratégia.
- O ponto de parada é muito radical e pode causar perdas adicionais. A configuração inadequada do ponto de parada pode causar perdas adicionais.
As soluções para os riscos são:
- Combinado com os indicadores de volatilidade, evite falsas rupturas.
- Optimizar os parâmetros para encontrar a combinação ideal de parâmetros.
- O que é que o governo está a fazer para evitar que a situação se torne demasiado radical?
Direção de otimização
A estratégia ainda tem espaço para ser melhorada:
-
Verificar a linha média em vários períodos de tempo, evitando que a curva seja muito sensível.
-
Combinação com outros indicadores como MACD para avaliar tendências e desvios.
-
Introdução de parâmetros de otimização dinâmica de algoritmos de aprendizagem de máquina.
Resumir
A estratégia de ruptura de regressão de linha média é uma estratégia de negociação quantitativa muito prática. Ela possui os benefícios de acompanhar a tendência, controlar o recuo, implementar uma estratégia simples e adequada para a necessidade de negociação quantitativa.
- 1