Estratégia de negociação multi-timeframe baseada no indicador de compressão


Data de criação: 2024-02-27 17:40:03 última modificação: 2024-02-27 17:40:03
cópia: 0 Cliques: 684
1
focar em
1617
Seguidores

Estratégia de negociação multi-timeframe baseada no indicador de compressão

Visão geral

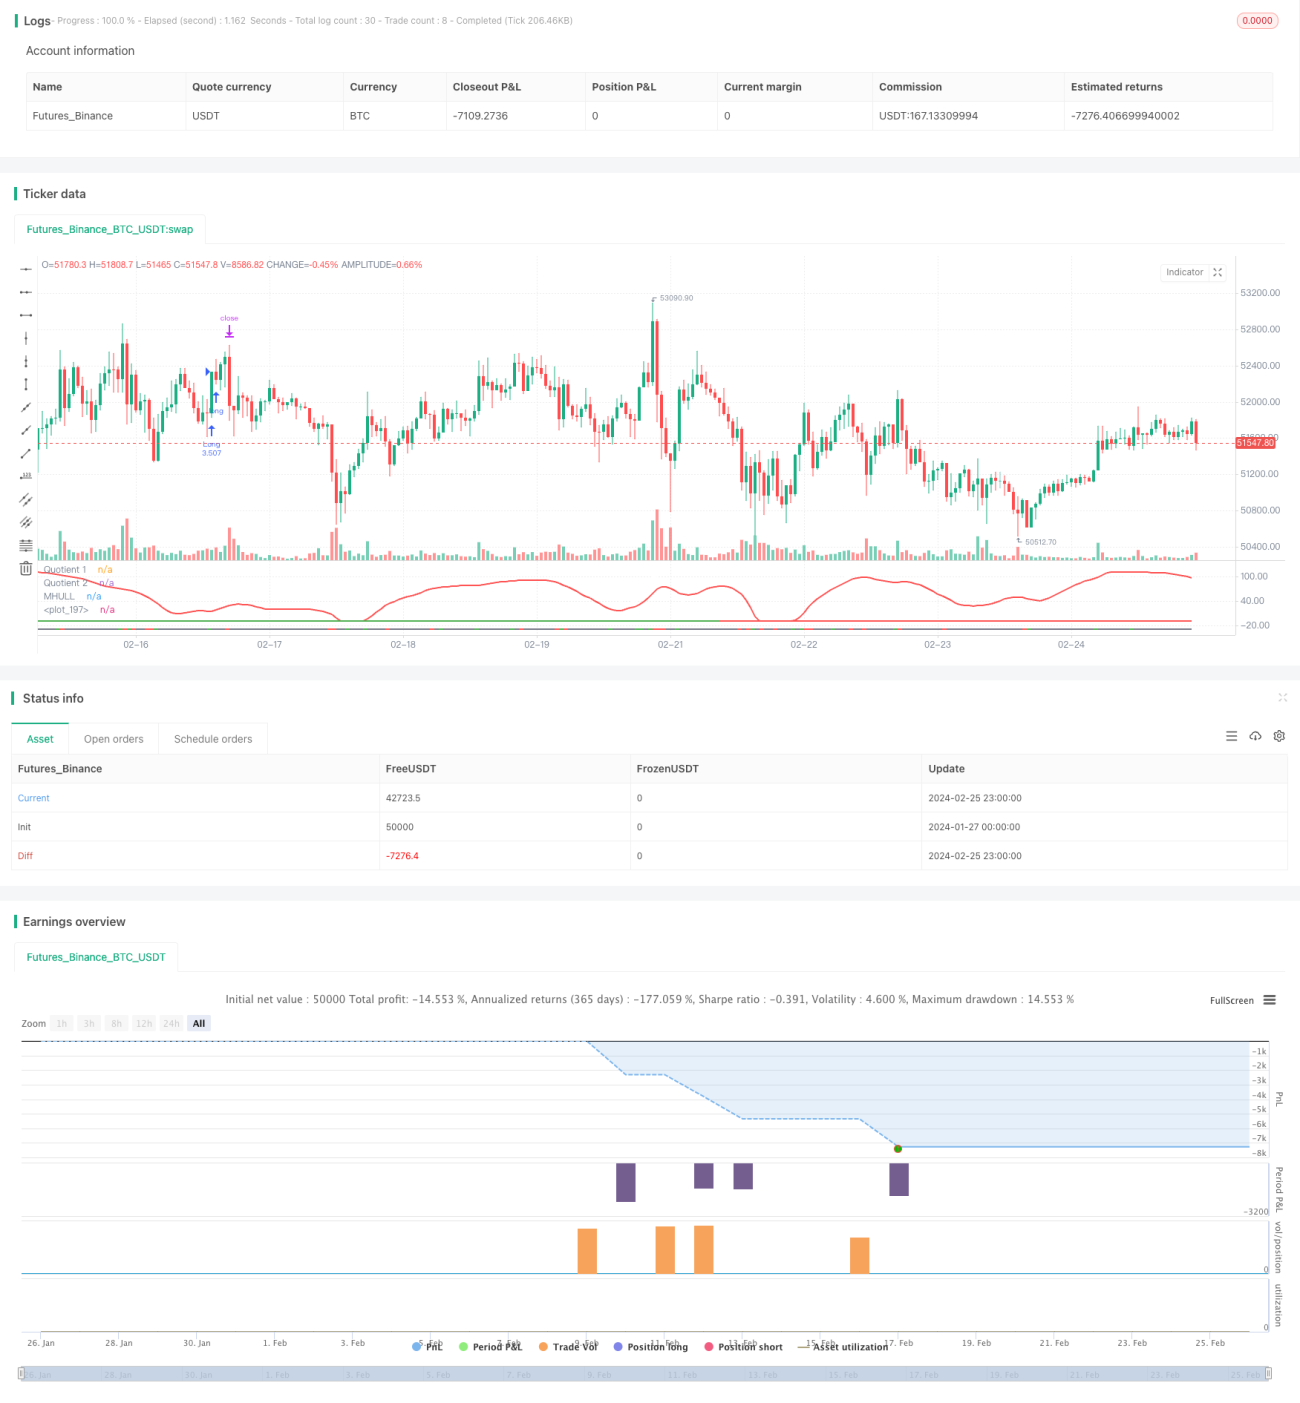
A estratégia combina três indicadores: Boom Hunter, Hull Suite e Volatility Oscillator, para uma estratégia quantitativa de acompanhamento de tendências e negociações de ruptura em vários períodos de tempo. A estratégia é aplicável a ativos digitais com alta volatilidade e situações de preços surpreendentes, como o Bitcoin.

Princípios

A lógica central da estratégia baseia-se nos seguintes três indicadores:

  1. Boom Hunter (em inglês): um oscilador que usa a compressão de indicadores para determinar os sinais de compra e venda através do cruzamento de dois indicadores (Quotient1 e Quotient2).

  2. Hull Suite (em inglês): um conjunto de indicadores de linha média móvel e suave, que julga a direção da tendência através da relação entre o eixo médio e o eixo superior e inferior.

  3. Oscilador de VolatilidadeO que é um indicador de oscilação de informações sobre oscilações de preços?

A lógica de entrada desta estratégia é que, ao mesmo tempo em que os dois indicadores de Quotient do caçador de tecidos se cruzam para cima ou para baixo, o preço deve romper o meio do Hull e se desviar do caminho superior ou inferior, enquanto o indicador de flutuação está localizado na região de sobrevenda. Isso pode filtrar alguns falsos sinais de ruptura e melhorar a precisão da entrada.

O stop loss é definido por um vale mínimo ou um pico máximo de um determinado período (default 20 K-line), e o lucro é obtido por um percentual de stop loss multiplicado pela proporção de stop loss da configuração (default 3x). A posição é calculada com base na porcentagem de total ativos da conta (default 3%) e na amplitude de stop loss de um determinado indicador.

Vantagens

  • Utilizando a técnica de compressão de indicadores para extrair os principais sinais de negociação dos preços e aumentar a probabilidade de lucro
  • Verificação de portfólio de indicadores múltiplos para evitar falsas rupturas e determinar com precisão a direção da tendência
  • Estabelecimento de um stop loss dinâmico para monitorar a tendência de forma a controlar o risco
  • Utilização de indicadores de volatilidade para garantir transações em ambientes de alta volatilidade
  • Análise de multi-quadros de tempo para aumentar a estabilidade estratégica

Riscos

  • Indicador de caçador de tecidos pode ter distorção de compressão, resultando em um sinal errado
  • O Hull Kit tem um atraso na transmissão e não consegue acompanhar a mudança de preço em tempo real.
  • Quando a volatilidade diminui, as oportunidades de negociação são perdidas ou o posicionamento de liquidação de perdas é desencadeado.

Solução:

  1. Ajustar os parâmetros do indicador de compressão, equilibrar a sensibilidade do indicador
  2. Tente usar uma média móvel como a EHMA em vez de um indicador intermediário.
  3. Adicionar outros indicadores de julgamento para evitar a distorção da volatilidade

Otimização

A estratégia pode ser melhorada em vários aspectos:

  1. Optimização de parâmetros: Obtenha o melhor conjunto de parâmetros alterando parâmetros indicadores, como comprimento de ciclo, coeficiente de compressão, etc.

  2. Otimização de prazosTeste diferentes períodos de tempo (de 1 minuto, 5 minutos, 30 minutos, etc.) para encontrar o melhor ciclo de negociação

  3. Optimização de posições- Alteração do tamanho e proporção das posições em cada transação para encontrar o melhor uso de capital

  4. Optimização de Stop LossAjustar as posições de stop loss de acordo com as diferentes transações para obter a melhor relação de risco/retorno

  5. Optimização de condiçõesAumentar ou diminuir as condições de filtragem dos indicadores para obter uma hora de entrada mais precisa

Resumir

A estratégia, através da combinação de três indicadores de caçador de telas, conjunto de Hull e oscilador de taxa de flutuação, permite negociações de acompanhamento de tendências em quadros de tempo múltiplos, capazes de identificar efetivamente o surto de preços, e é aplicável a ativos digitais com alta volatilidade. A estratégia é controlada pelo risco, otimizada em vários aspectos, como parâmetros, condições de flutuação e parada de prejuízos, e possui uma forte praticidade e escalabilidade.

Código-fonte da estratégia
/*backtest
start: 2024-01-27 00:00:00
end: 2024-02-26 00:00:00
period: 1h
basePeriod: 15m
exchanges: [{"eid":"Futures_Binance","currency":"BTC_USDT"}]
*/

// Strategy based on the 3 indicators:
//  - Boom Hunter Pro
//  - Hull Suite
//  - Volatility Oscillator
//
// Strategy was designed for the purpose of back testing. 
// See strategy documentation for info on trade entry logic.
// 
// Credits:
//  - Boom Hunter Pro: veryfid (https://www.tradingview.com/u/veryfid/)
//  - Hull Suite: InSilico (https://www.tradingview.com/u/InSilico/)
//  - Volatility Oscillator: veryfid (https://www.tradingview.com/u/veryfid/)

//@version=5
strategy("Boom Hunter + Hull Suite + Volatility Oscillator Strategy", overlay=false, initial_capital=1000, currency=currency.NONE, max_labels_count=500, default_qty_type=strategy.cash, commission_type=strategy.commission.percent, commission_value=0.01)

// =============================================================================
// STRATEGY INPUT SETTINGS
// =============================================================================

// ---------------
// Risk Management
// ---------------
swingLength = input.int(20, "Swing High/Low Lookback Length", group='Strategy: Risk Management', tooltip='Stop Loss is calculated by the swing high or low over the previous X candles')
accountRiskPercent = input.float(3, "Account percent loss per trade", step=0.1, group='Strategy: Risk Management', tooltip='Each trade will risk X% of the account balance')
profitFactor = input.float(3, "Profit Factor (R:R Ratio)", step = 0.1, group='Strategy: Risk Management')

// ----------
// Date Range
// ----------
start_year = input.int(title='Start Date', defval=2022, minval=2010, maxval=3000, group='Strategy: Date Range', inline='1')
start_month = input.int(title='', defval=1, group='Strategy: Date Range', inline='1', options = [1, 2, 3, 4, 5, 6, 7, 8, 9, 10, 11, 12])
start_date = input.int(title='', defval=1, group='Strategy: Date Range', inline='1', options = [1, 2, 3, 4, 5, 6, 7, 8, 9, 10, 11, 12, 13, 14, 15, 16, 17, 18, 19, 20, 21, 22, 23, 24, 25, 26, 27, 28, 29, 30, 31])
end_year = input.int(title='End Date', defval=2023, minval=1800, maxval=3000, group='Strategy: Date Range', inline='2')
end_month = input.int(title='', defval=1, group='Strategy: Date Range', inline='2', options = [1, 2, 3, 4, 5, 6, 7, 8, 9, 10, 11, 12])
end_date = input.int(title='', defval=1, group='Strategy: Date Range', inline='2', options = [1, 2, 3, 4, 5, 6, 7, 8, 9, 10, 11, 12, 13, 14, 15, 16, 17, 18, 19, 20, 21, 22, 23, 24, 25, 26, 27, 28, 29, 30, 31])
in_date_range = true

// =============================================================================
// INDICATORS
// =============================================================================

// ---------------
// Boom Hunter Pro
// ---------------
square = input.bool(true, title='Square Line?', group='Main Settings')
//Quotient
LPPeriod = input.int(6, title='Quotient | LPPeriod', inline='quotient', group='EOT 1 (Main Oscillator)')
K1 = input.int(0, title='K1', inline='quotient', group='EOT 1 (Main Oscillator)')
esize = 60  //, title = "Size", inline = "quotient2", group = "EOT 1 (Main Oscillator)")
ey = 50  //, title = "Y axis", inline = "quotient2", group = "EOT 1 (Main Oscillator)")
trigno = input.int(1, 'Trigger Length', group='EOT 1 (Main Oscillator)', inline='quotient2')
trigcol = input.color(color.white, title='Trigger Color:', group='EOT 1 (Main Oscillator)', inline='q2')

// EOT 2
//Inputs
LPPeriod2 = input.int(28, title='LPPeriod2', group='EOT 2 (Red Wave)', inline='q2')
K22 = input.float(0.3, title='K2', group='EOT 2 (Red Wave)', inline='q2')

//EOT 1
//Vars
alpha1 = 0.00
HP = 0.00
a1 = 0.00
b1 = 0.00
c1 = 0.00
c2 = 0.00
c3 = 0.00
Filt = 0.00
Peak = 0.00
X = 0.00
Quotient1 = 0.00
pi = 2 * math.asin(1)

//Highpass filter cyclic components
//whose periods are shorter than 100 bars
alpha1 := (math.cos(.707 * 2 * pi / 100) + math.sin(.707 * 2 * pi / 100) - 1) / math.cos(.707 * 2 * pi / 100)
HP := (1 - alpha1 / 2) * (1 - alpha1 / 2) * (close - 2 * nz(close[1]) + nz(close[2])) + 2 * (1 - alpha1) * nz(HP[1]) - (1 - alpha1) * (1 - alpha1) * nz(HP[2])

//SuperSmoother Filter
a1 := math.exp(-1.414 * pi / LPPeriod)
b1 := 2 * a1 * math.cos(1.414 * pi / LPPeriod)
c2 := b1
c3 := -a1 * a1
c1 := 1 - c2 - c3
Filt := c1 * (HP + nz(HP[1])) / 2 + c2 * nz(Filt[1]) + c3 * nz(Filt[2])

//Fast Attack - Slow Decay Algorithm
Peak := .991 * nz(Peak[1])
if math.abs(Filt) > Peak
    Peak := math.abs(Filt)
    Peak

//Normalized Roofing Filter
if Peak != 0
    X := Filt / Peak
    X

Quotient1 := (X + K1) / (K1 * X + 1)

// EOT 2
//Vars
alpha1222 = 0.00
HP2 = 0.00
a12 = 0.00
b12 = 0.00
c12 = 0.00
c22 = 0.00
c32 = 0.00
Filt2 = 0.00
Peak2 = 0.00
X2 = 0.00
Quotient4 = 0.00

alpha1222 := (math.cos(.707 * 2 * pi / 100) + math.sin(.707 * 2 * pi / 100) - 1) / math.cos(.707 * 2 * pi / 100)
HP2 := (1 - alpha1222 / 2) * (1 - alpha1222 / 2) * (close - 2 * nz(close[1]) + nz(close[2])) + 2 * (1 - alpha1222) * nz(HP2[1]) - (1 - alpha1222) * (1 - alpha1222) * nz(HP2[2])

//SuperSmoother Filter
a12 := math.exp(-1.414 * pi / LPPeriod2)
b12 := 2 * a12 * math.cos(1.414 * pi / LPPeriod2)
c22 := b12
c32 := -a12 * a12
c12 := 1 - c22 - c32
Filt2 := c12 * (HP2 + nz(HP2[1])) / 2 + c22 * nz(Filt2[1]) + c32 * nz(Filt2[2])

//Fast Attack - Slow Decay Algorithm
Peak2 := .991 * nz(Peak2[1])
if math.abs(Filt2) > Peak2
    Peak2 := math.abs(Filt2)
    Peak2

//Normalized Roofing Filter
if Peak2 != 0
    X2 := Filt2 / Peak2
    X2

Quotient4 := (X2 + K22) / (K22 * X2 + 1)
q4 = Quotient4 * esize + ey

//Plot EOT
q1 = Quotient1 * esize + ey
trigger = ta.sma(q1, trigno)
Plot3 = plot(trigger, color=trigcol, linewidth=2, title='Quotient 1')
Plot44 = plot(q4, color=color.new(color.red, 0), linewidth=2, title='Quotient 2')


// ----------
// HULL SUITE
// ----------

//INPUT
src = input(close, title='Source')
modeSwitch = input.string('Hma', title='Hull Variation', options=['Hma', 'Thma', 'Ehma'])
length = input(200, title='Length(180-200 for floating S/R , 55 for swing entry)')
lengthMult = input(2.4, title='Length multiplier (Used to view higher timeframes with straight band)')

useHtf = input(false, title='Show Hull MA from X timeframe? (good for scalping)')
htf = input.timeframe('240', title='Higher timeframe')

//FUNCTIONS
//HMA
HMA(_src, _length) =>
    ta.wma(2 * ta.wma(_src, _length / 2) - ta.wma(_src, _length), math.round(math.sqrt(_length)))
//EHMA    
EHMA(_src, _length) =>
    ta.ema(2 * ta.ema(_src, _length / 2) - ta.ema(_src, _length), math.round(math.sqrt(_length)))
//THMA    
THMA(_src, _length) =>
    ta.wma(ta.wma(_src, _length / 3) * 3 - ta.wma(_src, _length / 2) - ta.wma(_src, _length), _length)

//SWITCH
Mode(modeSwitch, src, len) =>
    modeSwitch == 'Hma' ? HMA(src, len) : modeSwitch == 'Ehma' ? EHMA(src, len) : modeSwitch == 'Thma' ? THMA(src, len / 2) : na

//OUT
_hull = Mode(modeSwitch, src, int(length * lengthMult))
HULL = useHtf ? request.security(syminfo.ticker, htf, _hull) : _hull
MHULL = HULL[0]
SHULL = HULL[2]

//COLOR
hullColor = MHULL > SHULL ? color.green : color.red

//PLOT
///< Frame
Fi1 = plot(-10, title='MHULL', color=hullColor, linewidth=2)

// -----------------
// VOLUME OSCILLATOR
// -----------------

volLength = input(80)
spike = close - open
x = ta.stdev(spike, volLength)
y = ta.stdev(spike, volLength) * -1
volOscCol = spike > x ? color.green : spike < y ? color.red : color.gray
plot(-30, color=color.new(volOscCol, transp=0), linewidth=2)


// =============================================================================
// STRATEGY LOGIC
// =============================================================================

// Boom Hunter Pro entry conditions
boomLong = ta.crossover(trigger, q4)
boomShort = ta.crossunder(trigger, q4)

// Hull Suite entry conditions
hullLong = MHULL > SHULL and close > MHULL
hullShort = MHULL < SHULL and close < SHULL

// Volatility Oscillator entry conditions
volLong = spike > x
volShort = spike < y

inLong = strategy.position_size > 0
inShort = strategy.position_size < 0

longCondition = boomLong and hullLong and volLong and in_date_range
shortCondition = boomShort and hullShort and volShort and in_date_range

swingLow = ta.lowest(source=low, length=swingLength)
swingHigh = ta.highest(source=high, length=swingLength)

atr = ta.atr(14)
longSl = math.min(close - atr, swingLow)
shortSl = math.max(close + atr, swingHigh)

longStopPercent = math.abs((1 - (longSl / close)) * 100)
shortStopPercent = math.abs((1 - (shortSl / close)) * 100)

longTpPercent = longStopPercent * profitFactor
shortTpPercent = shortStopPercent * profitFactor
longTp = close + (close * (longTpPercent / 100))
shortTp = close - (close * (shortTpPercent / 100))

// Position sizing (default risk 3% per trade)
riskAmt = strategy.equity * accountRiskPercent / 100
longQty = math.abs(riskAmt / longStopPercent * 100) / close
shortQty = math.abs(riskAmt / shortStopPercent * 100) / close

if (longCondition and not inLong)
    strategy.entry("Long", strategy.long, qty=longQty)
    strategy.exit("Long  SL/TP", from_entry="Long", stop=longSl, limit=longTp, alert_message='Long SL Hit')
    buyLabel = label.new(x=bar_index, y=high[1], color=color.green, style=label.style_label_up)
    label.set_y(id=buyLabel, y=-40)
    label.set_tooltip(id=buyLabel, tooltip="Risk Amt: " + str.tostring(riskAmt) + " Qty: " + str.tostring(longQty) + " Swing low: " + str.tostring(swingLow) + " Stop Percent: " + str.tostring(longStopPercent) + " TP Percent: " + str.tostring(longTpPercent))

if (shortCondition and not inShort)
    strategy.entry("Short", strategy.short, qty=shortQty)
    strategy.exit("Short  SL/TP", from_entry="Short", stop=shortSl, limit=shortTp, alert_message='Short SL Hit')
    sellLabel = label.new(x=bar_index, y=high[1], color=color.red, style=label.style_label_up)
    label.set_y(id=sellLabel, y=-40)
    label.set_tooltip(id=sellLabel, tooltip="Risk Amt: " + str.tostring(riskAmt) + " Qty: " + str.tostring(shortQty) + " Swing high: " + str.tostring(swingHigh) + " Stop Percent: " + str.tostring(shortStopPercent) + " TP Percent: " + str.tostring(shortTpPercent))