Estratégia de acompanhamento de tendência de confirmação tripla
Visão geral
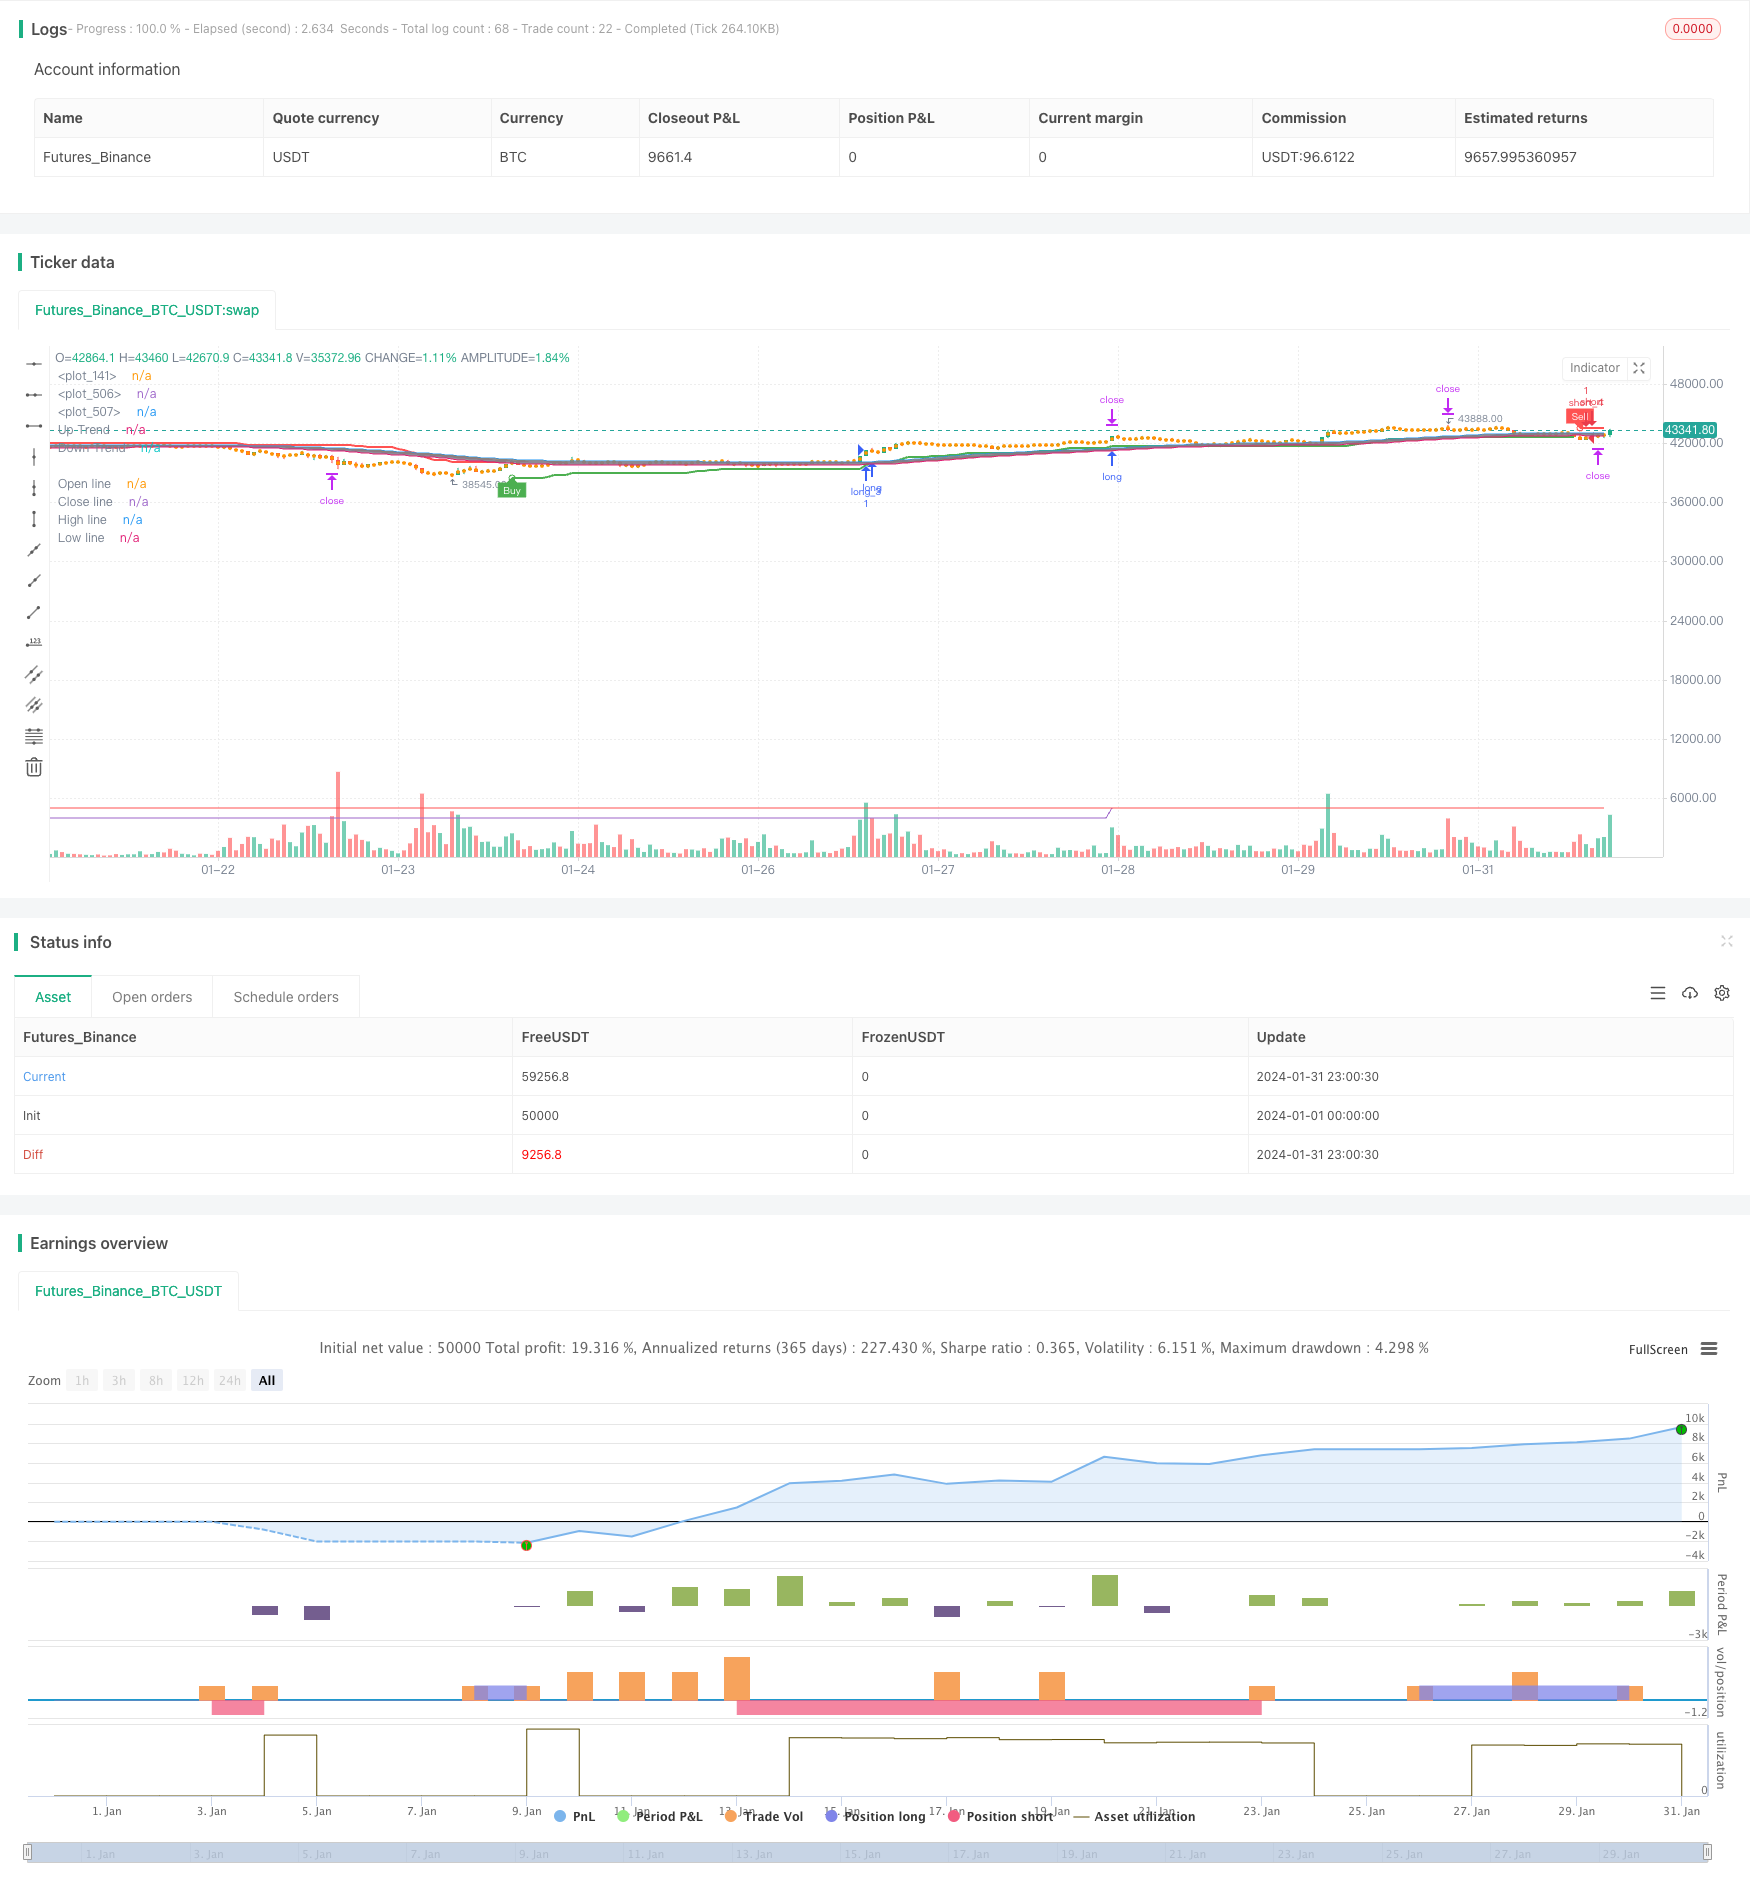
A estratégia de rastreamento de tendências de tripla confirmação capta uma alta probabilidade de tendência usando uma combinação de sinais de três indicadores principais, como linha média, linha de memória e super tendência. Quando os três indicadores principais emitem sinais de compra ou venda simultaneamente, a estratégia entra em ação e segue a tendência; Quando a tendência se inverte, a estratégia é rapidamente interrompida e o oponente fica vazio.
Princípio da estratégia
A linha média julga a tendência principal
A estratégia usa uma linha média de 52 ciclos para determinar a direção da tendência principal. Quando o preço atravessa a linha média acima, é considerado uma tendência ascendente; quando o preço atravessa a linha média abaixo, é considerado uma tendência descendente.
Reversão secundária de reconhecimento de linhas de memória
A estratégia usa simultaneamente a linha de intenção para identificar a reversão secundária de curto prazo. A linha de intenção é calculada de forma semelhante à linha média, mas o preço de CLOSE é substituído pelo preço de abertura, o que permite refletir mais rapidamente a informação de reversão de preço. Quando o preço atravessa a linha de intenção de queda acima, o sinal de rebote estável é sinalizado pela linha de intenção curta de preços; Quando o preço atravessa a linha de intenção de aumento abaixo, o sinal de retorno curto é sinalizado pelo preço.
O ponto de viragem de uma super tendência
A estratégia também combina o indicador de tendência super com o indicador de tendência super com o período da janela e os dados de preço do indicador ATR, ajustando dinamicamente o canal para cima e para baixo, para determinar o momento da reversão.
Tripla confirmação de filtragem de sinal
A estratégia só faz mais quando os três indicadores emitem sinais de compra ao mesmo tempo. Quando os três indicadores emitem sinais de venda ao mesmo tempo, a estratégia fica vazia. Com a confirmação do indicador triplo, pode-se filtrar efetivamente os falsos sinais e aumentar a probabilidade de entrada.
Análise de vantagens
Julgamento multidimensional, alta probabilidade
A estratégia combina os três indicadores da linha média, da linha do esquecimento e da super tendência para julgar tendências e pontos críticos de diferentes dimensões, garantindo uma alta probabilidade de entrada.
A resposta rápida, acompanhamento em tempo real
A introdução da linha do esquecimento garante que a estratégia possa reagir rapidamente à inversão da linha curta dos preços; o indicador de tendência super-adaptado do ATR para o canal também pode acompanhar as mudanças de preços em tempo real.
Paragem automática de perda, controle de risco eficaz
A estratégia incorpora uma lógica de stop-loss automática, que pode ser ajustada de acordo com a dinâmica do ATR para controlar efetivamente os perdas individuais.
Riscos e soluções
Risco de frequência de transação excessiva
Como os sinais de negociação estratégica são freqüentes, é fácil causar excesso de negociação. O parâmetro de ciclo da linha média pode ser aumentado de forma apropriada, reduzindo a frequência de negociação.
Risco de incerteza inversa
A eficácia da linha de intenção e do indicador de tendência super não é certa para determinar o ponto de reversão, podendo haver risco de erro de julgamento. Pode-se aumentar a condição de filtragem dos parâmetros do indicador, garantindo um sinal de reversão de maior probabilidade.
Risco de perdas em situações de turbulência
Em situações de choque, a estratégia pode abrir posições com frequência e parar, causando risco de perda devido ao cruzamento repetido. A estratégia pode ser identificada em situações de choque e, nesse momento, a estratégia pode ser suspensa.
Direção de otimização
Indicador de volatilidade
Pode-se considerar a combinação de indicadores de taxa de flutuação, como a faixa de Brin. Quando o preço está perto da faixa de Brin, evite abrir novas posições, evitando efetivamente o risco de um mercado turbulento.
Adição de filtros de entrada
Pode-se tentar adicionar outros indicadores auxiliares de julgamento, como KDJ, MACD, etc., apenas quando eles também emitem sinais ao mesmo tempo. Isso pode filtrar ainda mais os sinais falsos e reduzir o desnecessário negócio.
Otimização de estratégias de stop loss
Otimizar estratégias de stop-loss, como stop-loss móvel, stop-loss móvel indexado, stop-loss intercalar, etc., pode aumentar a lucratividade e ser mais estável.
Resumir
A estratégia de rastreamento de tendências de tripla confirmação aproveita ao máximo as vantagens dos três principais indicadores de linha média, linha de esquecimento e super tendência, permitindo o julgamento e captura de tendências com alta probabilidade. Ao mesmo tempo, configura um mecanismo de parada automático para controlar efetivamente os prejuízos individuais. Vale a pena otimizar ainda mais, pois pode ser combinado com outros indicadores auxiliares para filtrar a entrada, bem como melhorar a estratégia de parada de perda, tornando a estratégia mais prática.
/*backtest
start: 2024-01-01 00:00:00
end: 2024-01-31 23:59:59
period: 1h
basePeriod: 15m
exchanges: [{"eid":"Futures_Binance","currency":"BTC_USDT"}]
*/

//@version=5


//custom variables
hei_col = 0  //1 for green 0 for red
qqe_col = 0  //1 for blue 0 for red
supa_col = 0  //1 for buy 0 for sell
float upratr=0
float lwratr=0
//end


strategy(title='Death_star', overlay=true,calc_on_every_tick = true)

ma_type = input.string(title='MA Type', defval='EMA', options=['EMA', 'SMA', 'SWMA', 'VWMA', 'WMA'])
ma_period = input.int(title='MA Period (Length)', defval=52, minval=1)
ma_period_smoothing = input.int(title='MA Period smoothing (Length)', defval=10, minval=1)

color_positive = input(title='Positive color (Bullish)', defval=color.new(#26A69A, 50))
color_negative = input(title='Negative color (Bearish)', defval=color.new(#EF5350, 50))
color_hl = input(title='High & Low cloud color', defval=color.new(#808080, 80))

show_line = input(title='Show (lines)', defval=false)
show_hl_cloud = input(title='Show (High & Low cloud)', defval=true)
show_oc_cloud = input(title='Show (Open & Close cloud)', defval=true)

//————————————————————————————————————————————————————————————————————————————————
// I.2. Settings, Function definition — — — — — — — — — — — — — — — — — — — — — —
//————————————————————————————————————————————————————————————————————————————————

f_ma_type(input_ma_type, input_source, input_ma_period) =>
    result = float(na)

    if input_ma_type == 'EMA'
        result := ta.ema(input_source, input_ma_period)
        result
    if input_ma_type == 'SMA'
        result := ta.sma(input_source, input_ma_period)
        result
    if input_ma_type == 'SWMA'
        result := ta.swma(input_source)
        result
    if input_ma_type == 'VWMA'
        result := ta.vwma(input_source, input_ma_period)
        result
    if input_ma_type == 'WMA'
        result := ta.wma(input_source, input_ma_period)
        result

    result

//————————————————————————————————————————————————————————————————————————————————
// II.1. Calculations, MA — — — — — — — — — — — — — — — — — — — — — — — — — — — —
//————————————————————————————————————————————————————————————————————————————————

o = f_ma_type(ma_type, open, ma_period)
c = f_ma_type(ma_type, close, ma_period)
h = f_ma_type(ma_type, high, ma_period)
l = f_ma_type(ma_type, low, ma_period)

//————————————————————————————————————————————————————————————————————————————————
// II.2. Calculations, Heikin Ashi — — — — — — — — — — — — — — — — — — — — — — — —
//————————————————————————————————————————————————————————————————————————————————

ha = ticker.heikinashi(syminfo.tickerid)

ha_o = request.security(ha, timeframe.period, o)
ha_c = request.security(ha, timeframe.period, c)
ha_h = request.security(ha, timeframe.period, h)
ha_l = request.security(ha, timeframe.period, l)

//————————————————————————————————————————————————————————————————————————————————
// II.3. Calculations, MA (Smoothing) — — — — — — — — — — — — — — — — — — — — — —
//————————————————————————————————————————————————————————————————————————————————

ha_o_smooth = f_ma_type(ma_type, ha_o, ma_period_smoothing)
ha_c_smooth = f_ma_type(ma_type, ha_c, ma_period_smoothing)
ha_h_smooth = f_ma_type(ma_type, ha_h, ma_period_smoothing)
ha_l_smooth = f_ma_type(ma_type, ha_l, ma_period_smoothing)

//————————————————————————————————————————————————————————————————————————————————
// III.1. Display, Colors — — — — — — — — — — — — — — — — — — — — — — — — — — — —
//————————————————————————————————————————————————————————————————————————————————

tren = ha_c_smooth >= ha_o_smooth

color_trend = tren ? color_positive : color_negative

hei_col := tren ? 1 : 0

color_show_line_positive = show_line ? color_positive : na
color_show_line_negative = show_line ? color_negative : na

color_show_hl_cloud = show_hl_cloud ? color_hl : na
color_show_oc_cloud = show_oc_cloud ? color_trend : na

//————————————————————————————————————————————————————————————————————————————————
// III.2. Display, Plotting & Filling — — — — — — — — — — — — — — — — — — — — — —
//————————————————————————————————————————————————————————————————————————————————

o_line = plot(ha_o_smooth, color=color_show_line_positive, title='Open line')
c_line = plot(ha_c_smooth, color=color_show_line_negative, title='Close line')

h_line = plot(ha_h_smooth, color=color_show_line_positive, title='High line')
l_line = plot(ha_l_smooth, color=color_show_line_negative, title='Low line')

fill(o_line, c_line, color=color_show_oc_cloud, title='Open & Close Trendcloud', transp=90)
fill(h_line, l_line, color=color_show_hl_cloud, title='High & Low Trendcloud', transp=90)

upratr:=(ha_h_smooth)
lwratr:=(ha_l_smooth)
// supa


Periods = input(title='ATR Period', defval=9)
src = input(hl2, title='Source')
Multiplier = input.float(title='ATR Multiplier', step=0.1, defval=3.9)
changeATR = input(title='Change ATR Calculation Method ?', defval=true)
showsignals = input(title='Show Buy/Sell Signals ?', defval=true)
highlighting = input(title='Highlighter On/Off ?', defval=true)
atr2 = ta.sma(ta.tr, Periods)
atr = changeATR ? ta.atr(Periods) : atr2
up = src - Multiplier * atr
up1 = nz(up[1], up)
up := close[1] > up1 ? math.max(up, up1) : up
dn = src + Multiplier * atr
dn1 = nz(dn[1], dn)
dn := close[1] < dn1 ? math.min(dn, dn1) : dn
trend = 1
trend := nz(trend[1], trend)
trend := trend == -1 and close > dn1 ? 1 : trend == 1 and close < up1 ? -1 : trend
upPlot = plot(trend == 1 ? up : na, title='Up Trend', style=plot.style_linebr, linewidth=2, color=color.new(color.green, 0))
buySignal = trend == 1 and trend[1] == -1
plotshape(buySignal ? up : na, title='UpTrend Begins', location=location.absolute, style=shape.circle, size=size.tiny, color=color.new(color.green, 0))
plotshape(buySignal and showsignals ? up : na, title='Buy', text='Buy', location=location.absolute, style=shape.labelup, size=size.tiny, color=color.new(color.green, 0), textcolor=color.new(color.white, 0))
dnPlot = plot(trend == 1 ? na : dn, title='Down Trend', style=plot.style_linebr, linewidth=2, color=color.new(color.red, 0))
sellSignal = trend == -1 and trend[1] == 1
plotshape(sellSignal ? dn : na, title='DownTrend Begins', location=location.absolute, style=shape.circle, size=size.tiny, color=color.new(color.red, 0))
plotshape(sellSignal and showsignals ? dn : na, title='Sell', text='Sell', location=location.absolute, style=shape.labeldown, size=size.tiny, color=color.new(color.red, 0), textcolor=color.new(color.white, 0))
mPlot = plot(ohlc4, title='', style=plot.style_circles, linewidth=0)
longFillColor = highlighting ? trend == 1 ? color.green : color.white : color.white
shortFillColor = highlighting ? trend == -1 ? color.red : color.white : color.white
supa_col := trend == 1 ? 1 : 0
fill(mPlot, upPlot, title='UpTrend Highligter', color=longFillColor, transp=90)
fill(mPlot, dnPlot, title='DownTrend Highligter', color=shortFillColor, transp=90)
alertcondition(buySignal, title='SuperTrend Buy', message='SuperTrend Buy!')
alertcondition(sellSignal, title='SuperTrend Sell', message='SuperTrend Sell!')
changeCond = trend != trend[1]
alertcondition(changeCond, title='SuperTrend Direction Change', message='SuperTrend has changed direction!')

//QQE


//By Glaz, Modified
//study("QQE MOD")
RSI_Period = input(6, title='RSI Length')
SF = input(5, title='RSI Smoothing')
QQE = input(3, title='Fast QQE Factor')
ThreshHold = input(3, title='Thresh-hold')
//

srctt = input(close, title='RSI Source')
//

//
Wilders_Period = RSI_Period * 2 - 1


Rsi = ta.rsi(srctt, RSI_Period)
RsiMa = ta.ema(Rsi, SF)
AtrRsi = math.abs(RsiMa[1] - RsiMa)
MaAtrRsi = ta.ema(AtrRsi, Wilders_Period)
dar = ta.ema(MaAtrRsi, Wilders_Period) * QQE

longband = 0.0
shortband = 0.0
trenda = 0

DeltaFastAtrRsi = dar
RSIndex = RsiMa
newshortband = RSIndex + DeltaFastAtrRsi
newlongband = RSIndex - DeltaFastAtrRsi
longband := RSIndex[1] > longband[1] and RSIndex > longband[1] ? math.max(longband[1], newlongband) : newlongband
shortband := RSIndex[1] < shortband[1] and RSIndex < shortband[1] ? math.min(shortband[1], newshortband) : newshortband
cross_1 = ta.cross(longband[1], RSIndex)
trenda := ta.cross(RSIndex, shortband[1]) ? 1 : cross_1 ? -1 : nz(trenda[1], 1)
FastAtrRsiTL = trenda == 1 ? longband : shortband
////////////////////


length = input.int(50, minval=1, title='Bollinger Length')
mult = input.float(0.35, minval=0.001, maxval=5, step=0.1, title='BB Multiplier')
basis = ta.sma(FastAtrRsiTL - 50, length)
dev = mult * ta.stdev(FastAtrRsiTL - 50, length)
upper = basis + dev
lower = basis - dev
color_bar = RsiMa - 50 > upper ? #00c3ff : RsiMa - 50 < lower ? #ff0062 : color.gray


//
// Zero cross
QQEzlong = 0
QQEzlong := nz(QQEzlong[1])
QQEzshort = 0
QQEzshort := nz(QQEzshort[1])
QQEzlong := RSIndex >= 50 ? QQEzlong + 1 : 0
QQEzshort := RSIndex < 50 ? QQEzshort + 1 : 0
//

//Zero = hline(0, color=color.rgb(116, 26, 26), linestyle=hline.style_dotted, linewidth=1)

////////////////////////////////////////////////////////////////

RSI_Period2 = input(6, title='RSI Length')
SF2 = input(5, title='RSI Smoothing')
QQE2 = input(1.61, title='Fast QQE2 Factor')
ThreshHold2 = input(3, title='Thresh-hold')

src2 = input(close, title='RSI Source')
//

//
Wilders_Period2 = RSI_Period2 * 2 - 1


Rsi2 = ta.rsi(src2, RSI_Period2)
RsiMa2 = ta.ema(Rsi2, SF2)
AtrRsi2 = math.abs(RsiMa2[1] - RsiMa2)
MaAtrRsi2 = ta.ema(AtrRsi2, Wilders_Period2)
dar2 = ta.ema(MaAtrRsi2, Wilders_Period2) * QQE2
longband2 = 0.0
shortband2 = 0.0
trend2 = 0

DeltaFastAtrRsi2 = dar2
RSIndex2 = RsiMa2
newshortband2 = RSIndex2 + DeltaFastAtrRsi2
newlongband2 = RSIndex2 - DeltaFastAtrRsi2
longband2 := RSIndex2[1] > longband2[1] and RSIndex2 > longband2[1] ? math.max(longband2[1], newlongband2) : newlongband2
shortband2 := RSIndex2[1] < shortband2[1] and RSIndex2 < shortband2[1] ? math.min(shortband2[1], newshortband2) : newshortband2
cross_2 = ta.cross(longband2[1], RSIndex2)
trend2 := ta.cross(RSIndex2, shortband2[1]) ? 1 : cross_2 ? -1 : nz(trend2[1], 1)
FastAtrRsi2TL = trend2 == 1 ? longband2 : shortband2


//
// Zero cross
QQE2zlong = 0
QQE2zlong := nz(QQE2zlong[1])
QQE2zshort = 0
QQE2zshort := nz(QQE2zshort[1])
QQE2zlong := RSIndex2 >= 50 ? QQE2zlong + 1 : 0
QQE2zshort := RSIndex2 < 50 ? QQE2zshort + 1 : 0
//

hcolor2 = RsiMa2 - 50 > ThreshHold2 ? color.silver : RsiMa2 - 50 < 0 - ThreshHold2 ? color.silver : na
// plot(FastAtrRsi2TL - 50, title='QQE Line', color=color.new(color.white, 0), linewidth=2)
// plot(RsiMa2 - 50, color=hcolor2, title='Histo2', style=plot.style_columns, transp=50)

Greenbar1 = RsiMa2 - 50 > ThreshHold2
Greenbar2 = RsiMa - 50 > upper

Redbar1 = RsiMa2 - 50 < 0 - ThreshHold2
Redbar2 = RsiMa - 50 < lower
// plot(Greenbar1 and Greenbar2 == 1 ? RsiMa2 - 50 : na, title='QQE Up', style=plot.style_columns, color=color.new(#00c3ff, 0))
// plot(Redbar1 and Redbar2 == 1 ? RsiMa2 - 50 : na, title='QQE Down', style=plot.style_columns, color=color.new(#ff0062, 0))

qqe_col:=Greenbar1 and Greenbar2 == 1 ?1:(Redbar1 and Redbar2 == 1 ?0:-1)


//lab=label.new(bar_index,50,str.tostring(qqe_col))


// ////////////////////////////////////////////////////////////////

// //custom code

// ////////////////////////////////////////////////////////////////


// sma=((lhitt+shitt)/cnt)
// plot(sma*1000)
// plot(250,color=color.red)


//begin


sess=input("0916-1200","time for reversals!!")
v=time(timeframe.period,sess)
rr=input.float(1,"enter the reward..def is 3")
on=na(v)?false:true
bool daybreak=input.bool(false,"daybreak ? true means day end close")
bool apply_on=input.bool(true,"do u want time for reversal?")
apply_on:=not apply_on
test=input.int(2,"train(0) test(1) all(2)?")
// if str.tonumber(timeframe.period)!=5
//     runtime.error("backtests and stocks only valid for 5 min tf!!")
on:=apply_on or on


pts=1/syminfo.mintick
var float sl=0
var float profit=0
// var dud=0
// var counter=0
var con_win=0
var con_lose=0
var tempwin=0
var templose=0
//adding analytics variables
var float[] stararr=array.new_float(10,-1)
var float[] sslarr=array.new_float(10,-1)
var float skipper=-1
var float[] ltararr=array.new_float(10,-1)
var float[] lslarr=array.new_float(10,-1)

var float lhit=0
var float shit=0
var float miss=0
var float cnt=0
var lflag=0
var sflag=0
var i=0
var dud=0
var gap=0
float begin=0
float end=0
// ei_col = 0  //1 for green 0 for red
// qqe_col = 0  //1 for blue 0 for red
// supa_col = 0
//plot(i)
//code begins here
if test==0
    begin:=0
    end:=5500/2
else if test==1
    begin:=5500/2
    end:=bar_index
else if test==2
    begin:=0
    end:=bar_index


if  hei_col==1 and qqe_col==1 and supa_col==1 and lflag==0 and low>upratr and bar_index>=begin and bar_index<=end and on
    lflag:=1
    sflag:=0
    if array.get(lslarr,i)!=-1
        dud:=dud+1
    array.set(lslarr,i,upratr)
    array.set(ltararr,i,(close+rr*(close-upratr)))
    cnt:=cnt+1
    skipper:=i
   // lab=label.new(bar_index,close+100,str.tostring(array.get(lslarr,i)) +"\n"+  str.tostring(array.get(ltararr,i)) +"\n"+str.tostring(i))
    i:=(i+1)%9
    strategy.order("long_"+str.tostring(i-1),strategy.long,1)
    strategy.order("sl_l"+str.tostring(i-1),strategy.short,stop=upratr,oca_name = "exit"+str.tostring(i-1))
    strategy.order("target_l"+str.tostring(i-1),strategy.short,limit=((close+rr*(close-upratr))),oca_name = "exit"+str.tostring(i-1))

if  hei_col==0 and qqe_col==0 and supa_col==0 and sflag==0 and high<lwratr and bar_index>=begin and bar_index<=end and on
    sflag:=1
    lflag:=0
    if array.get(sslarr,i)!=-1
        dud:=dud+1
    array.set(sslarr,i,lwratr)
    array.set(stararr,i,(close-rr*(lwratr-close)))
    skipper:=i
  //  lab=label.new(bar_index,close+100,str.tostring(array.get(sslarr,i)) +"\n"+  str.tostring(array.get(stararr,i)) +"\n"+str.tostring(i))
    i:=(i+1)%9
    cnt:=cnt+1
    strategy.order("short_"+str.tostring(i-1),strategy.short,1)
    strategy.order("sl_s"+str.tostring(i-1),strategy.long,stop=lwratr,oca_name = "exit"+str.tostring(i-1))
    strategy.order("target_s"+str.tostring(i-1),strategy.long,limit=((close-rr*(lwratr-close))),oca_name = "exit"+str.tostring(i-1))


for j=0 to 9
    if array.get(lslarr,j)!=-1 and j!=skipper
        if low < array.get(lslarr,j)  and array.get(lslarr,j)!=-1// and open>array.get(lslarr,j)
            miss:=miss+1
            array.set(ltararr,j,-1)
            array.set(lslarr,j,-1)

        else if high > array.get(ltararr,j)  and array.get(lslarr,j)!=-1 //and open<array.get(ltararr,j)
            lhit:=lhit+1
            array.set(ltararr,j,-1)
            array.set(lslarr,j,-1)

    if array.get(sslarr,j)!=-1 and j!=skipper


        if high > array.get(sslarr,j) and array.get(sslarr,j)!=-1 //and open<array.get(sslarr,j)
            miss:=miss+1
            array.set(stararr,j,-1)
            array.set(sslarr,j,-1)
        else if low < array.get(stararr,j) and array.get(sslarr,j)!=-1 //and open>array.get(stararr,j)
            shit:=shit+1
            array.set(stararr,j,-1)
            array.set(sslarr,j,-1)
skipper:=-1
var day_miss=0
string ender=""
if (timeframe.period)=="1"
    ender:="1528-1529"
else if (timeframe.period)=="5"
    ender:="1520-1525"
else if (timeframe.period)=="15"
    ender:="1500-1515"
else if (timeframe.period)=="60"
    ender:="1330-1430"
else
    //runtime.error("not accounted tf!!")
    daybreak:=false
if time(timeframe.period,ender) and daybreak
    if strategy.position_size!=0
        day_miss+=1
        strategy.cancel_all()
        strategy.close_all("day_end_close")
        for k=0 to (array.size(stararr)==0?na:(array.size(stararr)-1))
            array.set(stararr,k,-1)
            array.set(sslarr,k,-1)

            array.set(ltararr,k,-1)
            array.set(lslarr,k,-1)
    i:=0


if (lhit+shit)>(lhit[1]+shit[1])
    tempwin:=tempwin+1
    templose:=0

else if (miss)>(miss[1])
    templose:=templose+1
    tempwin:=0

if tempwin>con_win
    con_win:=tempwin
if templose>con_lose
    con_lose:=templose


// //*********************adding randomness indicator************

var float nhit=0,var float nphit=0
if cnt%10==0 and cnt>0
    nhit:=(lhit+shit)-nphit
    nphit:=(lhit+shit)

t=table.new(position.top_right,1,6,bgcolor = color.rgb(236, 172, 172))
table.cell(t,0,0,str.tostring(((lhit+shit)/cnt)*100))
table.cell(t,0,1,str.tostring(((lhit+shit)/(lhit+shit+miss))*100))
table.cell(t,0,2,"daymiss "+str.tostring(day_miss))
//table.cell(t,0,1,str.tostring(((lhit)/cnt)*100))
//table.cell(t,0,2,str.tostring(((shit)/cnt)*100))
table.cell(t,0,3,str.tostring(con_win))
// table.cell(t,0,4,str.tostring(gap))
table.cell(t,0,4,str.tostring(con_lose))
table.cell(t,0,5,str.tostring(cnt))
//plot(1000*cnt,color =color.rgb(105, 28, 28))
// // plot(40000+lhit+shit,color=strategy.closedtrades%10==0?color.green:color.white,style=plot.style_circles)
//plot(1000*(lhit+shit),color=color.green)
//plot(1000*miss,color=color.red)

// // hitrate=strategy.wintrades/strategy.closedtrades
// // plot(hitrate*100)
// // plot(strategy.wintrades)
//plot(nhit*10000)
//dud is overwritten trades whereas day_miss are the trades closed at days end

// sma=(lhit+shit)/(lhit+shit+miss)
// plot(sma*100000)
// plot(50000,color=color.red)

// plot(con_win*1000,color=color.green)
// plot(con_lose*1000,color=color.red)


var float[] dat=array.new_float(10,-1)
var dati=0
var float datp=0
if miss>miss[1]
    for cd=0 to ((miss-miss[1])-1)
        array.set(dat,dati,0)
        dati:=(dati+1)%10
if (lhit+shit)>(lhit[1]+shit[1])
    for cd=0 to (  ((lhit+shit)-(lhit[1]+shit[1]))  -1)
        array.set(dat,dati,1)
        dati:=(dati+1)%10

if array.get(dat,9)!=-1
    for cd=0 to 9
        datp:=datp+array.get(dat,cd)

plot((datp/10)*10000)
plot(5000,color = color.red)
datp:=0