TrendHunter w/MF Estratégia de tendências de vários prazos

Autora:ChaoZhang, Data: 2024-03-15 16:01:54
Tags:

img

Resumo

TrendHunter w/MF Multi-Timeframe Trend Strategy é uma estratégia de seguimento de tendências baseada na análise abrangente de vários indicadores técnicos em vários prazos.

Princípio da estratégia

O princípio central desta estratégia é a análise abrangente de múltiplos indicadores técnicos em múltiplos prazos.

  1. Nuvem Ichimoku: Ao analisar a posição relativa do preço e da nuvem, bem como a posição relativa das médias móveis e da nuvem, a tendência atual do mercado é determinada.

  2. SuperTendência: Ao analisar a posição relativa do preço e da SuperTendência, a tendência atual do mercado é confirmada.

  3. WaveTrend: Ao analisar a direção e a posição do indicador WaveTrend, a tendência atual do mercado é determinada. Quando a WaveTrend está em alta e não atingiu a zona de sobrecompra, é considerada uma tendência de alta; quando a WaveTrend está caindo e não atingiu a zona de sobrevenda, é considerada uma tendência de queda.

  4. Fluxo de dinheiro: Ao analisar o estado do indicador de fluxo de dinheiro, a tendência atual do mercado é confirmada.

Para posições longas, a estratégia requer que o preço esteja acima da nuvem, a média móvel esteja acima da nuvem, a SuperTrend esteja em alta, a WaveTrend esteja em alta e não na zona de sobrecompra e o MoneyFlow seja positivo. O oposto se aplica às posições curtas. Esta filtragem rigorosa baseada em vários indicadores em vários prazos pode evitar efetivamente a negociação frequente em mercados de faixa, melhorando assim a estabilidade e confiabilidade da estratégia.

Análise das vantagens

  1. Julgamento abrangente baseado em múltiplos indicadores, elevada fiabilidade: Esta estratégia considera de forma abrangente múltiplos indicadores técnicos, que se complementam em diferentes condições de mercado, proporcionando um reflexo abrangente das tendências do mercado e evitando os erros que podem ocorrer com um único indicador.

  2. Condições de entrada rígidas, evitando a troca frequente: A estratégia estabelece condições de entrada rígidas, exigindo que vários indicadores sejam satisfeitos simultaneamente antes de entrar numa posição, o que evita efetivamente a troca frequente em mercados de gama e reduz o atrito da estratégia.

  3. Análise de vários prazos, compreensão da grande tendência: A estratégia realiza análises em vários prazos, o que ajuda a estratégia a compreender as principais tendências do mercado de uma perspectiva mais ampla, evitando interferências do ruído de curto prazo.

  4. Estratégia clara de stop-loss, risco controlado: a estratégia usa o SuperTrend como condição de stop-loss.

Análise de riscos

  1. Falta de ajuste dinâmico, capacidade limitada de responder às mudanças do mercado: As configurações de parâmetros desta estratégia são fixas e não têm a capacidade de se ajustar dinamicamente de acordo com as condições do mercado.

  2. Condições de entrada demasiado rigorosas podem fazer com que se percam boas oportunidades: as condições de entrada da estratégia são muito rigorosas, o que, embora possa evitar negociações frequentes, também pode fazer com que a estratégia perca algumas boas oportunidades de entrada.

  3. A adaptabilidade às condições extremas do mercado é desconhecida: a estratégia tem um bom desempenho em condições normais de mercado, mas a sua adaptabilidade a algumas condições extremas do mercado, como reversões rápidas e substanciais, ainda não foi testada.

  4. Estratégia de stop-loss relativamente simples, espaço para otimização: atualmente, a estratégia só usa a SuperTrend como condição de stop-loss.

Orientações de otimização

  1. Introduzir o julgamento das condições do mercado, ajustar dinamicamente os parâmetros: considerar a introdução de alguns indicadores de julgamento das condições do mercado, tais como indicadores de volatilidade, para ajustar dinamicamente os parâmetros da estratégia de acordo com as mudanças nas condições do mercado para se adaptar a diferentes ambientes de mercado.

  2. Otimizar as condições de entrada, melhorar a sensibilidade: considerar a otimização das condições de entrada, como a introdução de mais indicadores de confirmação, para melhorar a sensibilidade da estratégia, garantindo ao mesmo tempo a confiabilidade, capturando mais oportunidades comerciais.

  3. Adicionar medidas de resposta para condições de mercado extremas: para algumas condições de mercado extremas, como reversões rápidas e substanciais, considerar a introdução de algumas medidas de resposta especiais, como aumentar a intensidade do stop-loss ou suspender a negociação, para reduzir o risco da estratégia em condições de mercado extremas.

  4. Otimizar a estratégia de stop-loss, melhorar as capacidades de controle de risco: considerar a introdução de mais condições de stop-loss, como stop-loss de tempo, stop-loss de faixa, etc. Também considerar a introdução de algumas estratégias de stop-loss dinâmicas, como trailing stop-loss, para melhor controlar o risco.

Resumo

TrendHunter w/MF Multi-Timeframe Trend Strategy é uma estratégia de seguimento de tendências baseada em análise de múltiplos indicadores e de múltiplos prazos. Esta estratégia, através da consideração abrangente de fatores como Ichimoku Cloud, Moving Averages, SuperTrend, WaveTrend e MoneyFlow, configurações estritas de condições de entrada e análise de múltiplos prazos, pode capturar as principais tendências do mercado de forma relativamente confiável, evitando negociações frequentes em mercados de faixa, e tem boa estabilidade e confiabilidade.

Ao mesmo tempo, esta estratégia também apresenta algumas limitações e riscos, tais como a falta de capacidades de ajuste dinâmico, condições de entrada potencialmente demasiado rigorosas, adaptabilidade desconhecida a condições de mercado extremas e uma estratégia de stop-loss relativamente simples.

Em geral, a estratégia de tendência multi-tempo é uma estratégia de tendência com bom potencial. Ao usar essa estratégia, os traders devem entender plenamente seus princípios, vantagens e riscos, e fazer os ajustes e otimizações necessários de acordo com suas próprias preferências de risco e estilos de negociação. Ao mesmo tempo, eles também devem monitorar de perto as mudanças nas condições do mercado e ajustar a estratégia em tempo hábil para se adaptar às mudanças do mercado. Somente com base em uma compreensão profunda e uso prudente, essa estratégia pode aproveitar plenamente suas vantagens potenciais e trazer retornos estáveis para os traders.
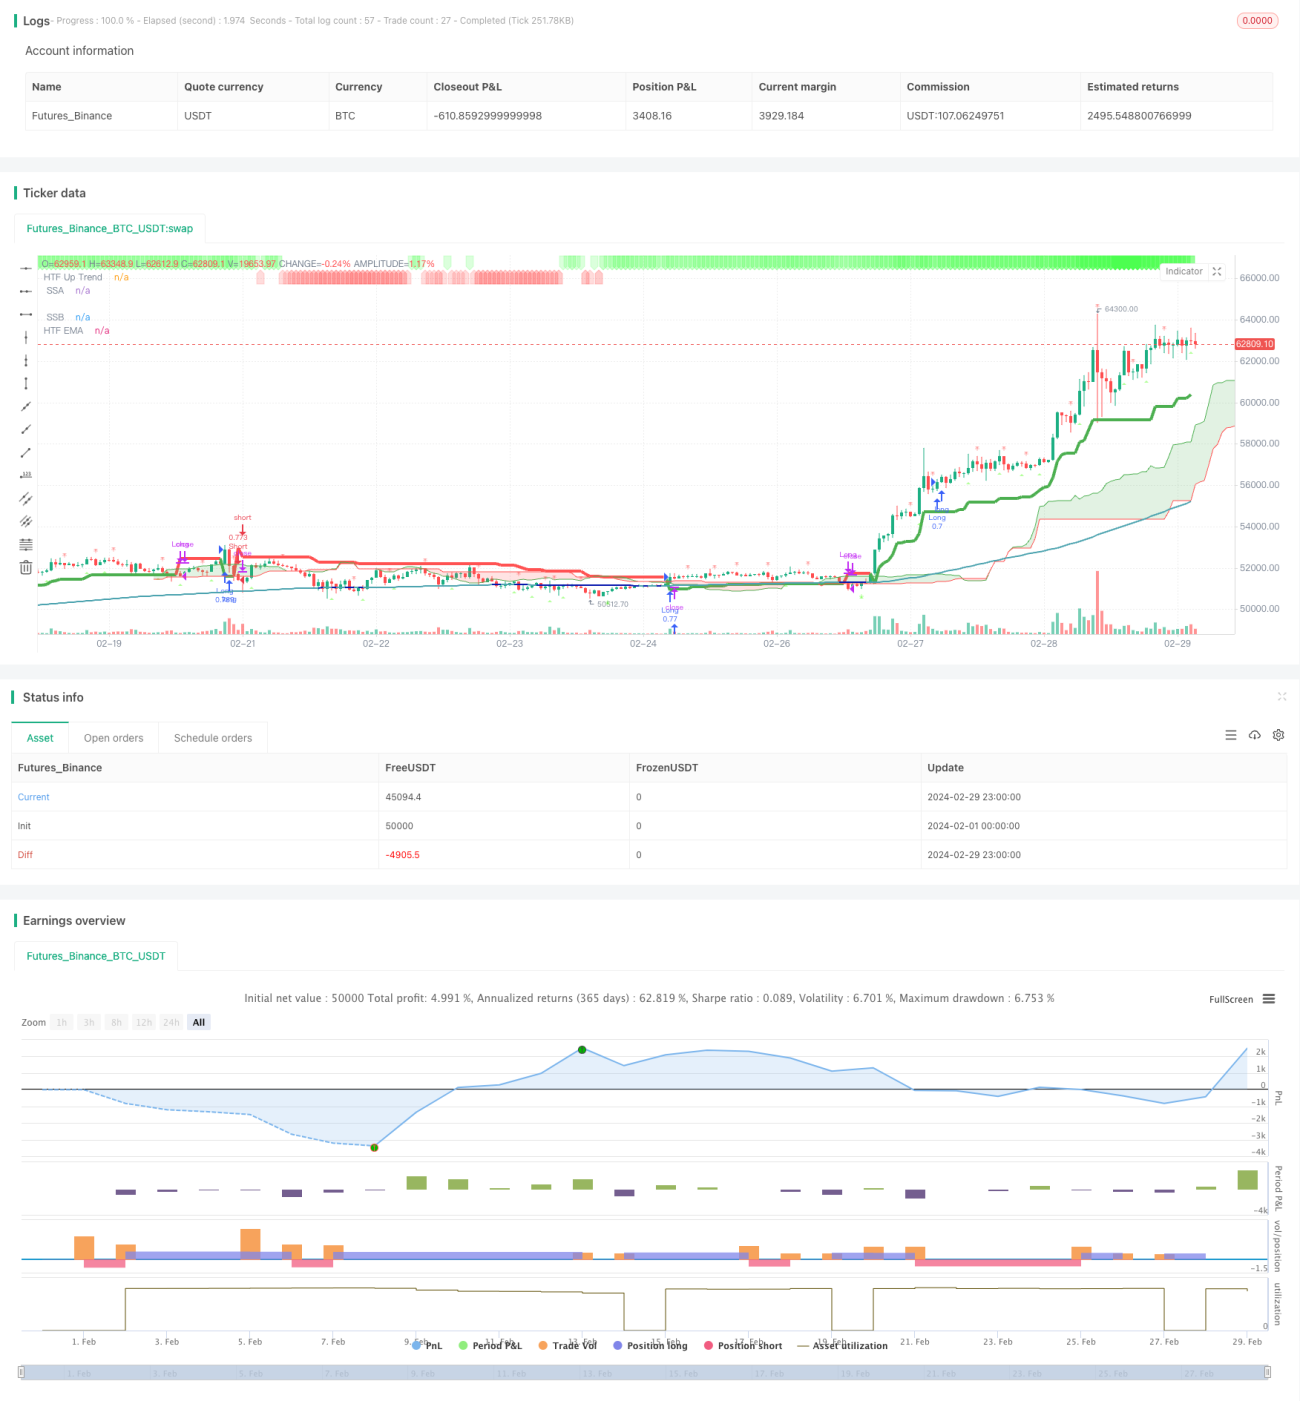

/*backtest
start: 2024-02-01 00:00:00
end: 2024-02-29 23:59:59
period: 1h
basePeriod: 15m
exchanges: [{"eid":"Futures_Binance","currency":"BTC_USDT"}]
*/

// This Pine Script™ code is subject to the terms of the Mozilla Public License 2.0 at https://mozilla.org/MPL/2.0/
// © godzcopilot / blockybears

// Thanks to anthonyf50 for his MTF Ichimoku https://www.tradingview.com/script/Pw9cBFma/
// Thanks to KivancOzbilgic for his SuperTrend https://www.tradingview.com/script/r6dAP7yi/
// Thanks to ZenAndTheArtOfTrading / PineScriptMastery for their Higher Timeframe EMA https://www.tradingview.com/script/Vh3XG9sD-Higher-Timeframe-EMA/
//  Thanks to LazyBear for WaveTrend Oscillator https://www.tradingview.com/script/2KE8wTuF-Indicator-WaveTrend-Oscillator-WT/
//  Thanks to andreholanda73 for MFI+RSI Area https://www.tradingview.com/script/UlGZzUAr/

//@version=5
strategy("TrendHunter w/MF [Blocky]", overlay=true, default_qty_type=strategy.percent_of_equity, default_qty_value=80, initial_capital=1000, pyramiding=0)

// ================
// Strategy Inputs
// ================

// Defines user inputs for configuring the strategy.

// Inputs for EMA
len     = input.int(title="EMA Length", defval=200, group ='== EMA ==')
col     = input.bool(title="Colour EMA", defval=true, group ='== EMA ==')

// SuperTrend
Periods = input(title='ATR: Period', defval=10, group = '== Supertrend ==', inline = 'atr')
Multiplier = input.float(title='Mult', step=0.1, defval=3.0, group = '== Supertrend ==', inline = 'atr')
Src = input.source(title='Src', defval=hl2, group = '== Supertrend ==', inline = 'atr')

// Ichimoku
conversionPeriods = input.int(9, minval=1, title='Conversion', group = '== Ichimoku ==', inline = 'ich1')
basePeriods = input.int(26, minval=1, title='Base', group = '== Ichimoku ==', inline = 'ich1')
laggingSpan2Periods = input.int(52, minval=1, title='Lagging', group = '== Ichimoku ==', inline = 'ich2')
displacement = input.int(26, minval=1, title='Displacement', group = '== Ichimoku ==', inline = 'ich2')

// Ichimoku Display Options
isActiveConversion = input(false, 'Conversion', group = '== Ichimoku ==', inline = 'lines1')
isActiveBase = input(false, 'Base', group = '== Ichimoku ==', inline = 'lines1')
isActiveLagging = input(false, 'Lagging', group = '== Ichimoku ==', inline = 'lines1')
isActiveCloud = input(true, 'Cloud', group = '== Ichimoku ==', inline = 'lines1')


// Input for WaveTrend
n1 = input(9, 'Channel Length', group = '== WaveTrend ==', inline = 'wt1')
n2 = input(12, 'Average Length', group = '== WaveTrend ==', inline = 'wt1')

obLevel = input(60, 'Over Bought', group = '== WaveTrend ==', inline = 'wt2')
osLevel = input(-60, 'Over Sold', group = '== WaveTrend ==', inline = 'wt2')

// Input for Money Flow
rsiMFIperiod = input(60, 'Money Flow Length', group = '== Money Flow ==', inline = 'mf')
rsiMFIMultiplier = input(190, 'RSI+MFI Area multiplier', group = '== Money Flow ==', inline = 'mf')
MFRSIMA = input.string(defval='SMA', title='Money Flow MA Type', options=['RMA', 'SMA', 'EMA', 'WMA', 'VWMA'], group = '== Money Flow ==', inline = 'mf')


// ================
// Strategy Options
// ================

bTable = input.bool(false, title='Trade Table', group='== Strategy Options ==', tooltip = "Show table that shows current selected options and trade trade entry parameters")

bLong = input.bool(true, title='Enter Longs', group='== Strategy Options ==', inline = 'LongShort')
bShort = input.bool(true, title='Enter Shorts', group='== Strategy Options ==', inline = 'LongShort', tooltip = "Filter long / short trade signals")

bPriceCloud = input.bool(true, title='Price outside cloud', group='== Strategy Options ==', inline='PriceCloud')
priceActionOption = input.string(title="", defval="Close", options=["Close", "Candle Body", "Full Candle"], group = "== Strategy Options ==", inline='PriceCloud')

bPriceEMA = input.bool(false, title='Price above/below EMA', group='== Strategy Options ==', inline='PriceEMA')
priceEMAOption = input.string(title="", defval="Close", options=["Close", "Candle Body", "Full Candle"], group = "== Strategy Options ==", inline='PriceEMA')

bSuper = input.bool(true, title='Supertrend transistions', group='== Strategy Options ==', tooltip = "Trade in direction of the supertrend transitions")

bEMACloud1 = input.bool(true, title='EMA Outside Cloud', group='== Strategy Options ==', tooltip = "EMA must be outside the ichimoku cloud")
bEMACloud2 = input.bool(false, title='EMA above/below Cloud', group='== Strategy Options ==', tooltip = "Longs when EMA above the cloud.\nShort when EMA below the cloud")

bMFI = input.bool(false, title='Money Flow', group='== Strategy Options ==', tooltip = "Money Flow Green for Long\nMoney Flow Red for Short")
bWT = input.bool(false, title='Wavetrend', group='== Strategy Options ==', inline = 'WT')
bWTOB = input.bool(false, title='Overbought/sold', group='== Strategy Options ==', tooltip = "Longs when WT Rising\nShort when WT Falling\n\nRestrict entries if in overbough or oversold levels",inline = 'WT')

bExitHTFTrail = input.bool(true, title='Super Trend Exits', group='== Strategy Options ==', inline = 'Exits')


// ===========================
// EMA Functions and Plotting
// ===========================

// Calculate EMA
ema = ta.ema(close, len)
emaSmooth = request.security(syminfo.tickerid, "", ema[barstate.isrealtime ? 1 : 0], gaps=barmerge.gaps_on)[barstate.isrealtime ? 0 : 1]


// Draw EMA
plot(emaSmooth, color=col ? (close > emaSmooth ? color.rgb(76, 163, 175) : color.rgb(6, 23, 173)) : color.black, linewidth=2, title="HTF EMA")


// ==================================
// Supertrend Functions and Plotting
// ==================================

// Function to calculate SuperTrend
calcSuperTrend(src, atrPeriods, multiplier) =>
    atr = ta.atr(atrPeriods)
    up = src - multiplier * atr
    up1 = nz(up[1], up)
    up := close[1] > up1 ? math.max(up, up1) : up
    dn = src + multiplier * atr
    dn1 = nz(dn[1], dn)
    dn := close[1] < dn1 ? math.min(dn, dn1) : dn
    trend = 1
    trend := nz(trend[1], trend)
    trend := trend == -1 and close > dn1 ? 1 : trend == 1 and close < up1 ? -1 : trend
    [up, dn, trend]


// Fetching the higher time frame data
[HTF_up, HTF_dn, HTF_trend] = request.security(syminfo.tickerid, "", calcSuperTrend(hl2, Periods, Multiplier), lookahead=barmerge.lookahead_on)

// Plotting for the higher time frame
plot(HTF_trend == 1 ? HTF_up : HTF_dn, title='HTF Up Trend', color= HTF_trend == 1 ? color.green : color.red, linewidth=4)


// ===============================
// Ichimoku Functions and Plotting
// ===============================

// Function to convert timeframe to hours
f_convertTimeframeToHours(tf) =>
    val = 0.0
    if tf == "1S" or tf == "S"
        val := 1.0 / 3600.0
    else if str.contains(tf, "S")
        val := str.tonumber(str.replace(tf, "S", "")) / 3600.0
    else if tf == "1D" or tf == "D"
        val := 24.0
    else if str.contains(tf, "D")
        val := str.tonumber(str.replace(tf, "D", "")) * 24.0
    else if tf == "1W" or tf == "W"
        val := 24.0 * 7.0
    else if str.contains(tf, "W")
        val := str.tonumber(str.replace(tf, "W", "")) * 24.0 * 7.0
    else if tf == "1M" or tf == "M"
        val := 24.0 * 30.0  // Approximation for a month
    else if str.contains(tf, "M")
        val := str.tonumber(str.replace(tf, "M", "")) * 24.0 * 30.0  // Approximation for months
    else
        // Default to minutes
        val := str.tonumber(tf) / 60.0
    val

// Time
timeOffset = time - time[1]


// Returns the displacement based on the chart / HTF resolution
f_getDisplacement(_res) =>
    _res == '' ? displacement : math.round(f_convertTimeframeToHours(_res) / f_convertTimeframeToHours(timeframe.period) * displacement)
    //f_avgDilationOf(_res) * displacement

// Returns average value between lowest and highest
f_avgLH(_len) =>
    math.avg(ta.lowest(_len), ta.highest(_len))

// Returns f_donchian data 
f_donchian(_tf, _src) =>
    request.security(syminfo.tickerid, _tf, _src, barmerge.gaps_off, barmerge.lookahead_on)

// Returns ichimoku data
f_ichimokuData(_tf) =>
    _isShow = _tf == '' or f_convertTimeframeToHours(_tf) >= f_convertTimeframeToHours(timeframe.period)
    _displacement = _isShow ? f_getDisplacement(_tf) : na
    _Conversion = _isShow ? f_donchian(_tf, f_avgLH(conversionPeriods)) : na
    _Base = _isShow ? f_donchian(_tf, f_avgLH(basePeriods)) : na
    _Lagging = _isShow ? f_donchian(_tf, close) : na
    _SSA = _isShow ? math.avg(_Conversion, _Base) : na
    _SSB = _isShow ? f_donchian(_tf, f_avgLH(laggingSpan2Periods)) : na
    _middleCloud = _isShow ? _SSA[0] > _SSB[0] ? _SSA[0] - math.abs(_SSA[0] - _SSB[0]) / 2 : _SSA[0] + math.abs(_SSA[0] - _SSB[0]) / 2 : na
    [_displacement, _Conversion, _Base, _Lagging, _SSA, _SSB, _middleCloud]

// Plotting ichimoku data

[Displacement, Conversion, Base, Lagging, SSA, SSB, fisrtMiddleCloud] = f_ichimokuData("")

// ————— Conversion
plot(isActiveConversion ? Conversion : na, color=color.new(color.blue, 0), title=' Conversion', linewidth=1)
// ————— Base
plot(isActiveBase ? Base : na, color=color.new(color.fuchsia, 0), title=' Base', linewidth=2)
// ————— Lagging
plot(isActiveLagging ? Lagging : na, offset=-Displacement, color=color.new(color.green, 0), title=' Lagging')

// ————— SSA + SSB
ssa = plot(isActiveCloud ? SSA : na, offset=Displacement, color=color.new(color.green, 0), title=' SSA', linewidth=1)
ssb = plot(isActiveCloud ? SSB : na, offset=Displacement, color=color.new(color.red, 0), title=' SSB', linewidth=1)
fill(ssa, ssb, color=color.new(SSA > SSB ? color.green : color.red , 80), title=' Cloud')


// ===============================
// Makret Cypher Additions
// ===============================


// WaveTrend calculations
ap = hlc3
esa = ta.ema(ap, n1)
d = ta.ema(math.abs(ap - esa), n1)
ci = (ap - esa) / (0.015 * d)
tci = ta.ema(ci, n2)

wt1 = tci
wt2 = ta.sma(wt1, 3)

// WaveTrend plotting
//plot(0, color=color.rgb(120, 123, 134), title='Zero Line')
//plot(emaSmooth + wt1, color=color.rgb(191, 228, 255), style=plot.style_linebr, title='WaveTrend 1')
//plot(emaSmooth + wt2, color=color.rgb(56, 56, 56, 40), style=plot.style_linebr, title='WaveTrend 2')

// WaveTrend shapes
plotshape(ta.crossover(wt1, wt2) and wt2[2] < osLevel ? close : na, title='Pos Crossover', location=location.belowbar, style=shape.cross, size=size.small, color=color.rgb(63, 255, 0, 60))
plotshape(ta.crossover(wt2, wt1) and wt1[2] > osLevel ? close : na, title='Neg Crossover', location=location.abovebar, style=shape.cross, size=size.small, color=color.rgb(255, 82, 82, 60))
plotshape(ta.crossover(wt1, wt2) and osLevel ? close : na, title='Positive Crossover', location=location.belowbar, style=shape.triangleup, size=size.tiny, color=color.rgb(63, 255, 0, 60))
plotshape(ta.crossover(wt2, wt1) and obLevel ?  close : na, title='Negative Crossover', location=location.abovebar, style=shape.triangledown, size=size.tiny, color=color.rgb(255, 82, 82, 60))

// Function to determine WaveTrend direction and steepness
isWaveTrendUp() =>
    wt1Slope = wt1 - wt1[1]
    wt2Slope = wt2 - wt2[1]
    if wt1 > wt2 // wt1Slope > 0 and wt2Slope > 0
        1  // Both are going up
    else if wt1 < wt2 // wt1Slope < 0 and wt2Slope < 0
        2 // Both are going down
    else
        na  // Trends are not in the same direction


ma(matype, src, length) =>
    if matype == 'RMA'
        ta.rma(src, length)
    else
        if matype == 'SMA'
            ta.sma(src, length)
        else
            if matype == 'EMA'
                ta.ema(src, length)
            else
                if matype == 'WMA'
                    ta.wma(src, length)
                else
                    if matype == 'VWMA'
                        ta.vwma(src, length)
                    else
                        src

// Money Flow calculations
candleValue = (close - open) / (high - low)
MVC = ma(MFRSIMA, candleValue, rsiMFIperiod)
MVC := MVC * rsiMFIMultiplier
mfi_transp = math.abs(MVC) > 35 ? 0 : math.abs(MVC) > 30 ? 20 : math.abs(MVC) > 25 ? 30 : math.abs(MVC) > 20 ? 40 : math.abs(MVC) > 15 ? 50 : math.abs(MVC) > 10 ? 60 : math.abs(MVC) > 5 ? 65 : math.abs(MVC) > 2 ? 70 : 80
color_area = MVC > 0 ? color.rgb(76, 255, 80, mfi_transp) : color.rgb(255, 82, 82, mfi_transp)

// Money Flow plotting
// RSIMFIplot = plot(MVC * rsiMFIMultiplier, title='Money Flow', color=color_area, style=plot.style_area)
// fill(RSIMFIplot, plot(0), color_area)

plotshape(MVC > 0 ? true : na, title='MFI', location=location.top, style=shape.labeldown, size= size.tiny, color=color_area)
plotshape(MVC < 0 ? true : na, title='MFI', location=location.top, style= shape.labelup, size= size.tiny, color=color_area)


// ===============================
// Strategy Entries
// ===============================

// Checks whether price is inside the Ichimoku cloud
f_PriceCloud(dir) =>
    _enter = false
    if bPriceCloud
        if bLong and dir == 1
            _enter := switch priceActionOption
                "Close" => close > math.max(SSA[Displacement], SSB[Displacement])
                "Candle Body" => open > math.max(SSA[Displacement], SSB[Displacement]) and close > math.max(SSA[Displacement], SSB[Displacement])
                "Full Candle" => low > math.max(SSA[Displacement], SSB[Displacement]) and high > math.max(SSA[Displacement], SSB[Displacement]) 
        if bShort and dir == 2
            _enter := switch priceActionOption
                "Close" => close < math.min(SSA[Displacement], SSB[Displacement])
                "Candle Body" => open < math.min(SSA[Displacement], SSB[Displacement]) and close < math.min(SSA[Displacement], SSB[Displacement])
                "Full Candle" => low < math.min(SSA[Displacement], SSB[Displacement]) and high < math.min(SSA[Displacement], SSB[Displacement]) 
    else
        _enter := na
    _enter

// Checks whether price is above / below the ema
f_PriceEMA(dir) =>
    _enter = false
    if bPriceEMA
        if bLong and dir == 1
            _enter := switch priceEMAOption
                "Close" => close > math.max(SSA[Displacement], SSB[Displacement])
                "Candle Body" => open > math.max(SSA[Displacement], SSB[Displacement]) and close > math.max(SSA[Displacement], SSB[Displacement])
                "Full Candle" => low > math.max(SSA[Displacement], SSB[Displacement]) and high > math.max(SSA[Displacement], SSB[Displacement]) 
        if bShort and dir == 2
            _enter := switch priceEMAOption
                "Close" => close < math.min(SSA[Displacement], SSB[Displacement])
                "Candle Body" => open < math.min(SSA[Displacement], SSB[Displacement]) and close < math.min(SSA[Displacement], SSB[Displacement])
                "Full Candle" => low < math.min(SSA[Displacement], SSB[Displacement]) and high < math.min(SSA[Displacement], SSB[Displacement]) 
    else
        _enter := na
    _enter

// Checks HTF supertrend direction
f_Super(dir) =>
    _enter = false
    if bSuper
        if bLong and dir == 1
            _enter := HTF_trend == 1
        if bShort and dir == 2
            _enter := HTF_trend == -1
    else
        _enter := na

    _enter

// Checks whether ema is inside the Ichimoku cloud
f_EMACloud1(dir) =>
    _enter = false
    if bEMACloud1
        if bLong and dir == 1
            _enter := (emaSmooth > math.max(SSA[Displacement], SSB[Displacement])) or (emaSmooth < math.min(SSA[Displacement], SSB[Displacement]))
        if bShort and dir == 2
            _enter := (emaSmooth > math.max(SSA[Displacement], SSB[Displacement])) or (emaSmooth < math.min(SSA[Displacement], SSB[Displacement]))
    else
        _enter := na
    _enter

// Checks whether ema is above/below Ichimoku cloud
f_EMACloud2(dir) =>
    _enter = false
    if bEMACloud2
        if bLong and dir == 1
            _enter := emaSmooth > math.max(SSA[Displacement], SSB[Displacement])
        if bShort and dir == 2
            _enter := emaSmooth < math.min(SSA[Displacement], SSB[Displacement])
    else
        _enter := na
    _enter

// Checks whether moneyflow is positive
f_MFI(dir) =>
    _enter = false
    if bMFI
        if bLong and dir == 1
            _enter := MVC > 0
        if bShort and dir == 2
            _enter := MVC < 0
    else
        _enter := na
    _enter


// Checks whether wavetrend is rising or falling
f_WT(dir) =>
    _enter = false
    if bWT
        if bLong and dir == 1
            _enter := isWaveTrendUp() == dir
        if bShort and dir == 2
            _enter := isWaveTrendUp() == dir
    else
        _enter := na
    _enter


f_WTOB(dir) =>
    _enter = false
    if bWT and bWTOB
        if bLong and dir == 1
            _enter := wt1 < obLevel
        if bShort and dir == 2
            _enter := wt1 > osLevel
    else
        _enter := na
    _enter


// Check if a value is 'na' or true.
f_NATrue(val) =>
    _enter = false
    if na(val)
        _enter := true
    if val
        _enter := true
    _enter   
    

// Consolidates entry conditions.
f_checkCondition(dir) =>
    _enter = false
    if na(f_PriceCloud(dir)) and na(f_PriceEMA(dir)) and na(f_Super(dir)) and na(f_EMACloud1(dir)) and na(f_EMACloud2(dir)) and na(f_MFI(dir)) and na(f_WT(dir)) and na(f_WTOB(dir))
        _enter := false
    else if f_NATrue(f_PriceCloud(dir)) and f_NATrue(f_PriceEMA(dir)) and f_NATrue(f_Super(dir)) and f_NATrue(f_EMACloud1(dir)) and f_NATrue(f_EMACloud2(dir)) and f_NATrue(f_MFI(dir)) and f_NATrue(f_WT(dir)) and f_NATrue(f_WTOB(dir))
        _enter := true
    _enter

        
// Execute long trade entries
longCondition = bLong and f_checkCondition(1)
if (longCondition)
    strategy.entry("Long", strategy.long)

// Execute short trade entries
shortCondition = bShort and f_checkCondition(2)
if (shortCondition)
    strategy.entry("Short", strategy.short)

// Excute trade exits
exitLong = (bExitHTFTrail and (close < HTF_up or HTF_trend == -1))
exitShort = (bExitHTFTrail and (close > HTF_dn or HTF_trend == 1))

if exitLong
    strategy.close("Long")

if exitShort
    strategy.close("Short")

// Creates a table shoing all the user options and their current status for entering a trade
if bTable
    // Create a table
    tbl = table.new(position = position.bottom_right, columns = 4, rows = 11, bgcolor=color.new(color.black,100), border_width = 0, frame_width = 0)

    table.cell(tbl, 1, 0, "Selected", text_halign = text.align_center, text_size = size.small, text_color = color.rgb(207, 207, 207))
    table.cell(tbl, 2, 0, "Long", bgcolor=na(bLong) ? color.new(color.black,100) : bShort ? color.rgb(4, 112, 8) : color.rgb(100, 7, 7), text_halign = text.align_center, text_size = size.small, text_color = color.rgb(207, 207, 207))
    table.cell(tbl, 3, 0, "Short", bgcolor=na(bShort) ? color.new(color.black,100) : bShort ? color.rgb(4, 112, 8) : color.rgb(100, 7, 7), text_halign = text.align_center, text_size = size.small, text_color = color.rgb(207, 207, 207))

    table.cell(tbl, 0, 1, "Entry", text_halign = text.align_left, text_size = size.small, text_color = color.rgb(207, 207, 207))
    table.cell(tbl, 2, 1, longCondition  ? "✓" : "✗", bgcolor=longCondition ? color.green : color.red, text_halign = text.align_center, text_size = size.small, text_color = color.rgb(207, 207, 207))
    table.cell(tbl, 3, 1, shortCondition  ? "✓" : "✗", bgcolor=shortCondition ? color.green : color.red, text_halign = text.align_center, text_size = size.small, text_color = color.rgb(207, 207, 207))


    table.cell(tbl, 0, 3, "Price Cloud", text_halign = text.align_left, text_size = size.small, text_color = color.rgb(207, 207, 207))
    table.cell(tbl, 1, 3, bPriceCloud ? "✓" : "✗", bgcolor=na(bPriceCloud) ? color.new(color.black,100) : bPriceCloud ? color.green : color.red, text_halign = text.align_center, text_size = size.small, text_color = color.rgb(207, 207, 207))
    table.cell(tbl, 2, 3, f_PriceCloud(1) ? "✓" : "✗", bgcolor=na(f_PriceCloud(1)) ? color.new(color.black,100) : f_PriceCloud(1) ? color.green : color.red, text_halign = text.align_center, text_size = size.small, text_color = color.rgb(207, 207, 207))
    table.cell(tbl, 3, 3, f_PriceCloud(2)  ? "✓" : "✗", bgcolor=na(f_PriceCloud(2)) ? color.new(color.black,100) : f_PriceCloud(2) ? color.green : color.red, text_halign = text.align_center, text_size = size.small, text_color = color.rgb(207, 207, 207))

    table.cell(tbl, 0, 4, "Price EMA", text_halign = text.align_left, text_size = size.small, text_color = color.rgb(207, 207, 207))
    table.cell(tbl, 1, 4, bPriceEMA ? "✓" : "✗", bgcolor=na(bPriceEMA) ? color.new(color.black,100) : bPriceEMA ? color.green : color.red, text_halign = text.align_center, text_size = size.small, text_color = color.rgb(207, 207, 207))
    table.cell(tbl, 2, 4, f_PriceEMA(1) ? "✓" : "✗", bgcolor=na(f_PriceEMA(1)) ? color.new(color.black,100) : f_PriceEMA(1) ? color.green : color.red, text_halign = text.align_center, text_size = size.small, text_color = color.rgb(207, 207, 207))
    table.cell(tbl, 3, 4, f_PriceEMA(2) ? "✓" : "✗", bgcolor=na(f_PriceEMA(2)) ? color.new(color.black,100) : f_PriceEMA(2) ? color.green : color.red, text_halign = text.align_center, text_size = size.small, text_color = color.rgb(207, 207, 207))

    table.cell(tbl, 0, 5, "SuperTrend", text_halign = text.align_left, text_size = size.small, text_color = color.rgb(207, 207, 207))
    table.cell(tbl, 1, 5, bSuper ? "✓" : "✗", bgcolor=na(bSuper) ? color.new(color.black,100) : bSuper ? color.green : color.red, text_halign = text.align_center, text_size = size.small, text_color = color.rgb(207, 207, 207))
    table.cell(tbl, 2, 5, f_Super(1) ? "✓" : "✗", bgcolor=na(f_Super(1)) ? color.new(color.black,100) : f_Super(1) ? color.green : color.red, text_halign = text.align_center, text_size = size.small, text_color = color.rgb(207, 207, 207))
    table.cell(tbl, 3, 5, f_Super(2) ? "✓" : "✗", bgcolor=na(f_Super(2)) ? color.new(color.black,100) : f_Super(2) ? color.green : color.red, text_halign = text.align_center, text_size = size.small, text_color = color.rgb(207, 207, 207))

    table.cell(tbl, 0, 6, "EMA Outside Cloud", text_halign = text.align_left, text_size = size.small, text_color = color.rgb(207, 207, 207))
    table.cell(tbl, 1, 6, bEMACloud1 ? "✓" : "✗", bgcolor=na(bEMACloud1) ? color.new(color.black,100) : bEMACloud1 ? color.green : color.red, text_halign = text.align_center, text_size = size.small, text_color = color.rgb(207, 207, 207))
    table.cell(tbl, 2, 6, f_EMACloud1(1) ? "✓" : "✗", bgcolor=na(f_EMACloud1(1)) ? color.new(color.black,100) : f_EMACloud1(1) ? color.green : color.red, text_halign = text.align_center, text_size = size.small, text_color = color.rgb(207, 207, 207))
    table.cell(tbl, 3, 6, f_EMACloud1(2) ? "✓" : "✗", bgcolor=na(f_EMACloud1(2)) ? color.new(color.black,100) : f_EMACloud1(2) ? color.green : color.red, text_halign = text.align_center, text_size = size.small, text_color = color.rgb(207, 207, 207))

    table.cell(tbl, 0, 7, "EMA Above/Below Cloud", text_halign = text.align_left, text_size = size.small, text_color = color.rgb(207, 207, 207))
    table.cell(tbl, 1, 7, bEMACloud2 ? "✓" : "✗", bgcolor=na(bEMACloud2) ? color.new(color.black,100) : bEMACloud2 ? color.green : color.red, text_halign = text.align_center, text_size = size.small, text_color = color.rgb(207, 207, 207))
    table.cell(tbl, 2, 7, f_EMACloud2(1) ? "✓" : "✗", bgcolor=na(f_EMACloud2(1)) ? color.new(color.black,100) : f_EMACloud2(1) ? color.green : color.red, text_halign = text.align_center, text_size = size.small, text_color = color.rgb(207, 207, 207))
    table.cell(tbl, 3, 7, f_EMACloud2(2) ? "✓" : "✗", bgcolor=na(f_EMACloud2(2)) ? color.new(color.black,100) : f_EMACloud2(2) ? color.green : color.red, text_halign = text.align_center, text_size = size.small, text_color = color.rgb(207, 207, 207))

    table.cell(tbl, 0, 8, "Moneyflow", text_halign = text.align_left, text_size = size.small, text_color = color.rgb(207, 207, 207))
    table.cell(tbl, 1, 8, bMFI ? "✓" : "✗", bgcolor=na(bMFI) ? color.new(color.black,100) : bMFI ? color.green : color.red, text_halign = text.align_center, text_size = size.small, text_color = color.rgb(207, 207, 207))
    table.cell(tbl, 2, 8, f_MFI(1) ? "✓" : "✗", bgcolor=na(f_MFI(1)) ? color.new(color.black,100) : f_MFI(1) ? color.green : color.red, text_halign = text.align_center, text_size = size.small, text_color = color.rgb(207, 207, 207))
    table.cell(tbl, 3, 8, f_MFI(2) ? "✓" : "✗", bgcolor=na(f_MFI(2)) ? color.new(color.black,100) : f_MFI(2) ? color.green : color.red, text_halign = text.align_center, text_size = size.small, text_color = color.rgb(207, 207, 207))

    table.cell(tbl, 0, 9, "WaveTrend", text_halign = text.align_left, text_size = size.small, text_color = color.rgb(207, 207, 207))
    table.cell(tbl, 1, 9, bWT ? "✓" : "✗", bgcolor=na(bWT) ? color.new(color.black,100) : bWT ? color.green : color.red, text_halign = text.align_center, text_size = size.small, text_color = color.rgb(207, 207, 207))
    table.cell(tbl, 2, 9, f_WT(1) ? "✓" : "✗", bgcolor=na(f_WT(1)) ? color.new(color.black,100) : f_WT(1) ? color.green : color.red, text_halign = text.align_center, text_size = size.small, text_color = color.rgb(207, 207, 207))
    table.cell(tbl, 3, 9, f_WT(2) ? "✓" : "✗", bgcolor=na(f_WT(2)) ? color.new(color.black,100) : f_WT(2) ? color.green : color.red, text_halign = text.align_center, text_size = size.small, text_color = color.rgb(207, 207, 207))

    table.cell(tbl, 0, 10, "Overbought/Sold  " + str.tostring(wt1, '#.#'), text_halign = text.align_left, text_size = size.small, text_color = color.rgb(207, 207, 207))
    table.cell(tbl, 1, 10, bWTOB ? "✓" : "✗", bgcolor=na(bWTOB) ? color.new(color.black,100) : bWTOB ? color.green : color.red, text_halign = text.align_center, text_size = size.small, text_color = color.rgb(207, 207, 207))
    table.cell(tbl, 2, 10, f_WTOB(1) ? "✓" : "✗", bgcolor=na(f_WTOB(1)) ? color.new(color.black,100) : f_WTOB(1) ? color.green : color.red, text_halign = text.align_center, text_size = size.small, text_color = color.rgb(207, 207, 207))
    table.cell(tbl, 3, 10, f_WTOB(2) ? "✓" : "✗", bgcolor=na(f_WTOB(2)) ? color.new(color.black,100) : f_WTOB(2) ? color.green : color.red, text_halign = text.align_center, text_size = size.small, text_color = color.rgb(207, 207, 207))


Mais.