Estratégia dupla RSI e Bandas de Bollinger

Visão geral
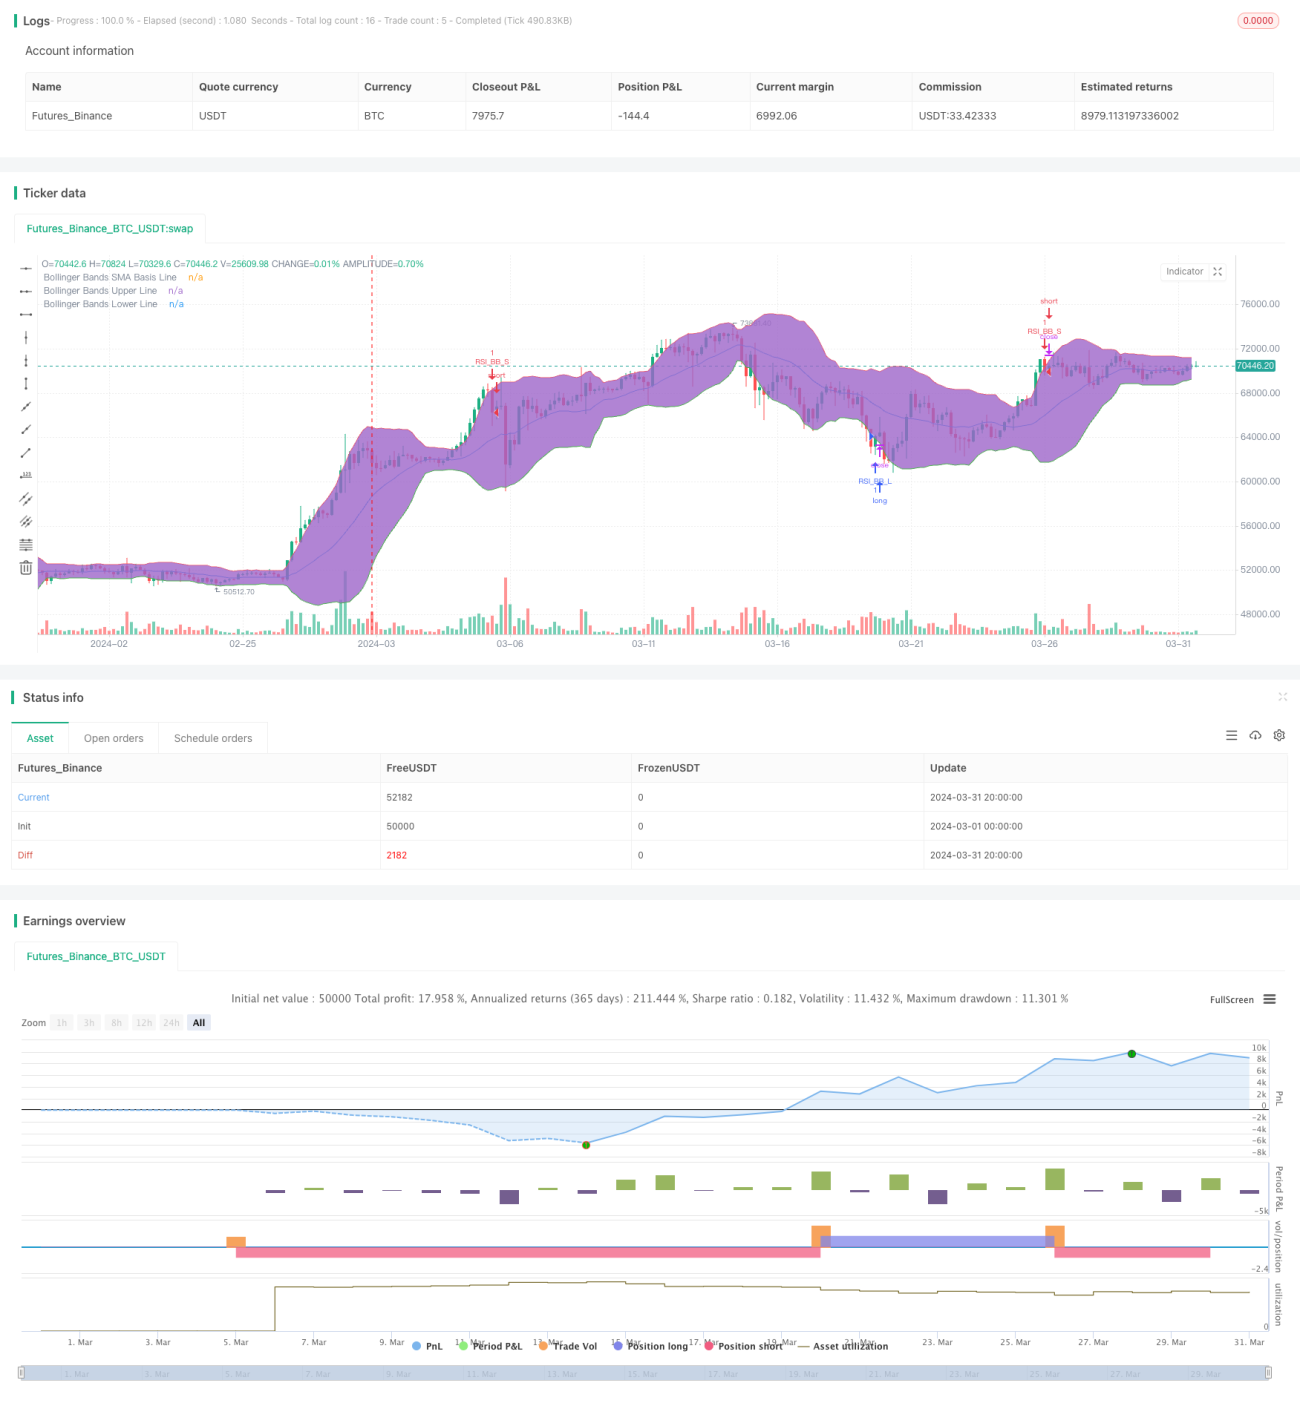
A estratégia combina dois indicadores técnicos, o RSI e as Bandas de Bollinger, que geram um sinal de compra quando o preço está abaixo da trajetória de Bollinger e um sinal de venda quando o preço está acima da trajetória de Bollinger. A estratégia apenas dispara um sinal de negociação quando o RSI e o indicador de Bollinger estão em um estado de sobrevenda ou sobrevenda ao mesmo tempo.
Princípio da estratégia
- Calcule o valor do RSI de acordo com o parâmetro RSI definido.
- Calcule o meio-carril, o trem superior e o trem inferior usando a fórmula da faixa de Brin.
- O preço de fechamento atual deve ser avaliado para determinar se o preço de fechamento atual está a subir ou a descer a faixa de Brin.
- O RSI deve ser avaliado para determinar se o valor atual está acima ou abaixo do limiar de superaquecimento.
- Quando o indicador Brin e o RSI satisfazem simultaneamente as condições de compra ou venda, gera-se o correspondente sinal de negociação.
Vantagens estratégicas
- A combinação de indicadores técnicos de tendência e dinâmica permite um julgamento mais abrangente do estado do mercado.
- A utilização simultânea de dois indicadores como condições de filtragem reduz a probabilidade de ocorrência de falsos sinais.
- A lógica do código é clara e os parâmetros são configurados de forma flexível para se adaptar a diferentes ambientes de mercado e estilos de negociação.
Risco estratégico
- Em mercados turbulentos, essa estratégia pode gerar mais perdas.
- A configuração inadequada dos parâmetros pode levar ao fraco desempenho da estratégia, que precisa ser otimizada de acordo com a situação real.
- A estratégia não tem um stop loss e pode ter um risco maior de retração.
Direção de otimização da estratégia
- Os parâmetros do RSI e do Brinks podem ser otimizados de acordo com as características do mercado e as preferências pessoais.
- A introdução de outros indicadores técnicos, como MACD, linha média, etc., aumenta a confiabilidade do sinal.
- Estabeleça um stop loss e um stop loss razoáveis para controlar o risco de uma única transação.
- Para mercados de turbulência, pode-se considerar aumentar os critérios de julgamento ou reduzir a posição, reduzindo os custos de transações frequentes.
Resumir
A dupla estratégia de RSI e Brin Belt, combinando indicadores de tendência e dinâmica, é capaz de avaliar a situação do mercado de forma mais abrangente e fornecer sinais de negociação correspondentes. No entanto, a estratégia pode ter um mau desempenho em mercados turbulentos e não estabelecer medidas de controle de risco, portanto, é necessário ter cuidado ao operar no mercado real.
/*backtest
start: 2024-03-01 00:00:00
end: 2024-03-31 23:59:59
period: 4h
basePeriod: 15m
exchanges: [{"eid":"Futures_Binance","currency":"BTC_USDT"}]
*/

//@version=4
strategy("Bollinger + RSI, Double Strategy (by ChartArt) v1.1", shorttitle="CA_-_RSI_Bol_Strat_1.1", overlay=true)

// ChartArt's RSI + Bollinger Bands, Double Strategy - Update- 1