Estratégia de Crossover MACD

Visão geral
A estratégia usa duas médias móveis indexadas de dois períodos diferentes (EMA) para cruzar, gerando um sinal de compra quando o EMA rápido atravessa o EMA lento de cima para baixo e um sinal de venda quando o EMA rápido atravessa o EMA lento de cima para baixo. A estratégia pode ser aplicada a vários instrumentos financeiros e períodos de tempo, como o ouro é mais eficaz no ciclo de 2 horas, o Bitcoin é mais eficaz no diagrama de linha do sol, etc.
Princípio da estratégia
- Calcule o EMA rápido (o ciclo padrão é 12) e o EMA lento (o ciclo padrão é 26).
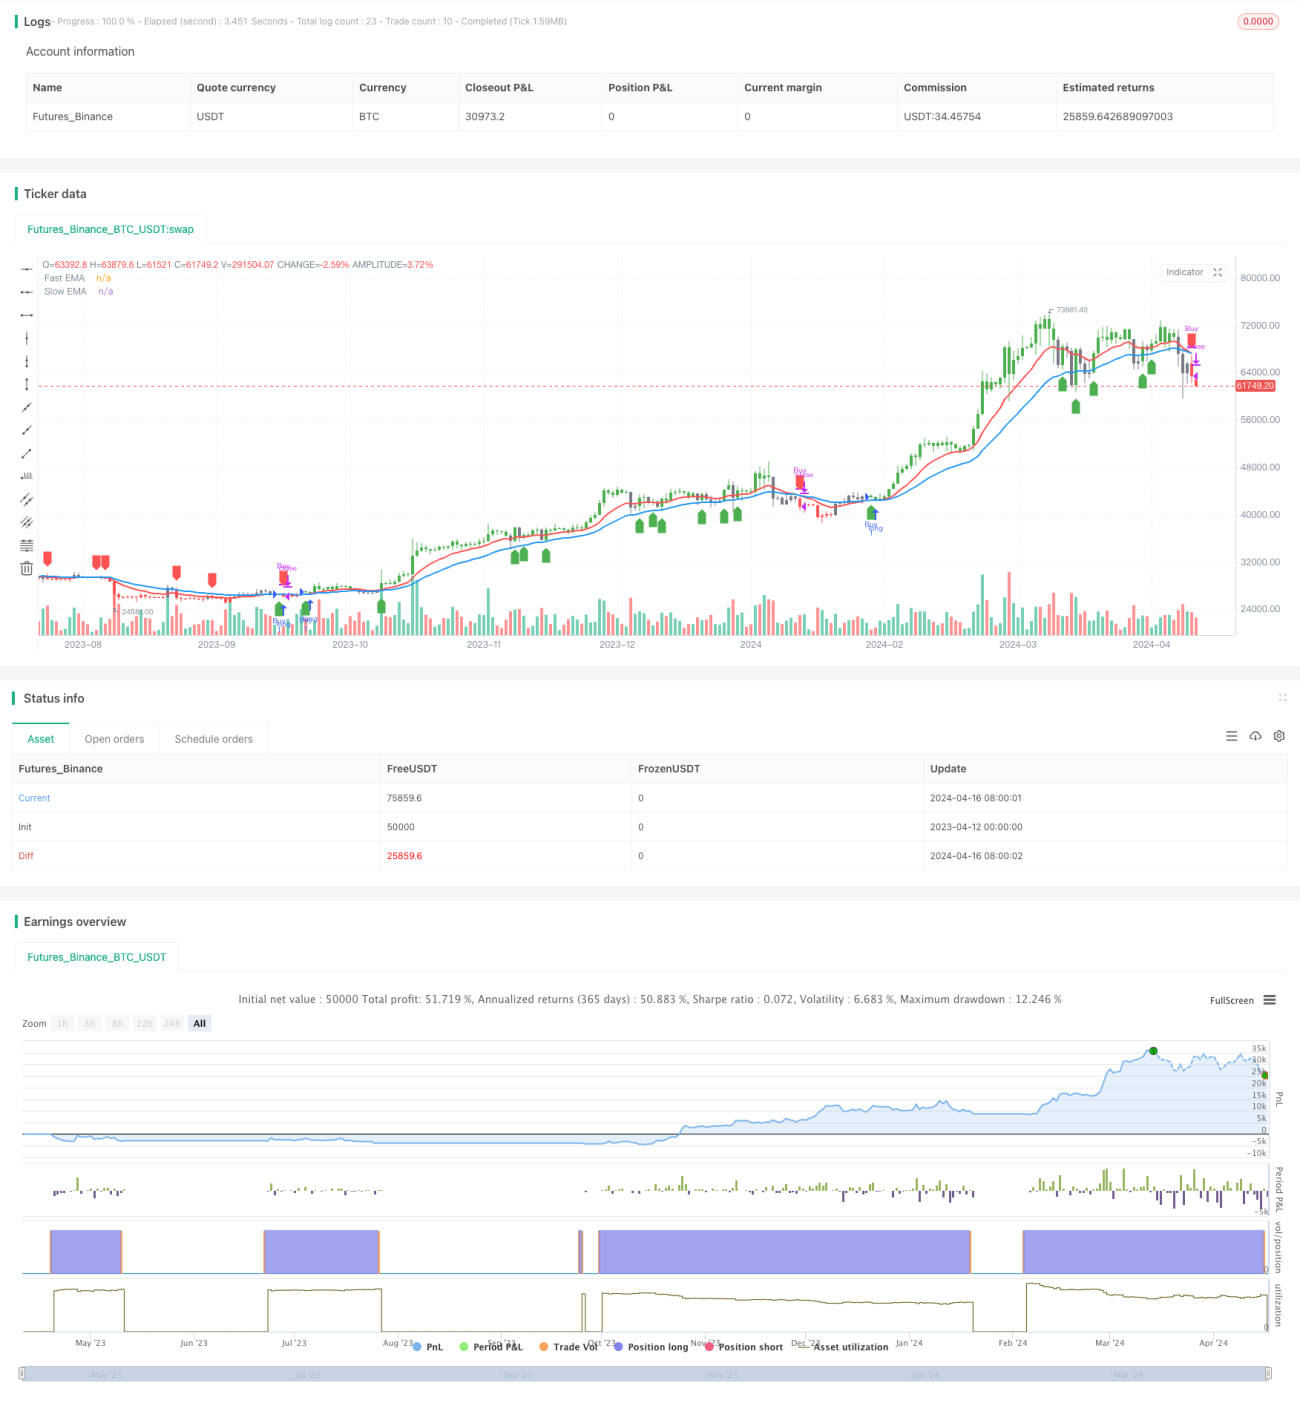
- Defina uma zona de múltiplos cabeçalhos ((uma EMA rápida acima de uma EMA lenta e um preço acima de uma EMA rápida) e uma zona de cabeçalhos vazios ((uma EMA rápida abaixo de uma EMA lenta e um preço abaixo de uma EMA rápida)).
- Comprar quando se converte de uma área de cabeçalho em uma área de cabeçalho e vender quando se converte de uma área de cabeçalho em uma área de cabeçalho.
- As áreas com mais cabeças e as áreas com cabeças vazias são marcadas em verde e vermelho no gráfico e os sinais de compra e venda são marcados com setas.
Vantagens estratégicas
- É simples e fácil de entender, para quem está começando.
- É muito versátil e pode ser usado em vários instrumentos financeiros e períodos de tempo.
- A plataforma tem uma forte capacidade de rastreamento de tendências, que permite capturar tendências de médio e longo prazo.
- Os parâmetros são ajustáveis, aumentando a flexibilidade.
Risco estratégico
- No entanto, a maioria das pessoas não sabe como lidar com a situação.
- A reação é lenta quando a tendência se inverte, o que pode causar alguns pontos de deslizamento.
- A escolha errada de parâmetros pode afetar a eficácia da política.
Direção de otimização da estratégia
- Adicionar filtros de tendência, como negociar apenas quando o ADX é maior do que um determinado valor, reduzindo os prejuízos em mercados de turbulência.
- Otimização do tempo de partida, como o uso do ATR para determinar o stop loss, reduzindo a perda individual.
- Otimizar os parâmetros, encontrar a melhor combinação de parâmetros, aumentar a estabilidade e a lucratividade.
- Em combinação com outros indicadores auxiliares, como MACD, RSI, etc., a precisão do sinal é melhorada.
Resumir
A estratégia de cruzamento MACD é uma estratégia simples baseada no acompanhamento de tendências, com vantagens de ser simples, prática e de ampla aplicação, com desvantagens de ser difícil de capturar a reversão da tendência e a escolha de parâmetros. O desempenho da estratégia pode ser melhorado por filtragem de tendências, otimização de saídas, escolha de parâmetros e combinação de outros indicadores.
/*backtest
start: 2023-04-12 00:00:00
end: 2024-04-17 00:00:00
period: 1d
basePeriod: 1h
exchanges: [{"eid":"Futures_Binance","currency":"BTC_USDT"}]
*/

//@version=5
strategy('Advance EMA Crossover Strategy', overlay=true, precision=6)
//****************************************************************************//
// CDC Action Zone is based on a simple EMA crossover - 1