Estratégia quantitativa de sinal de cruzamento RSI e Double EMA

Visão geral
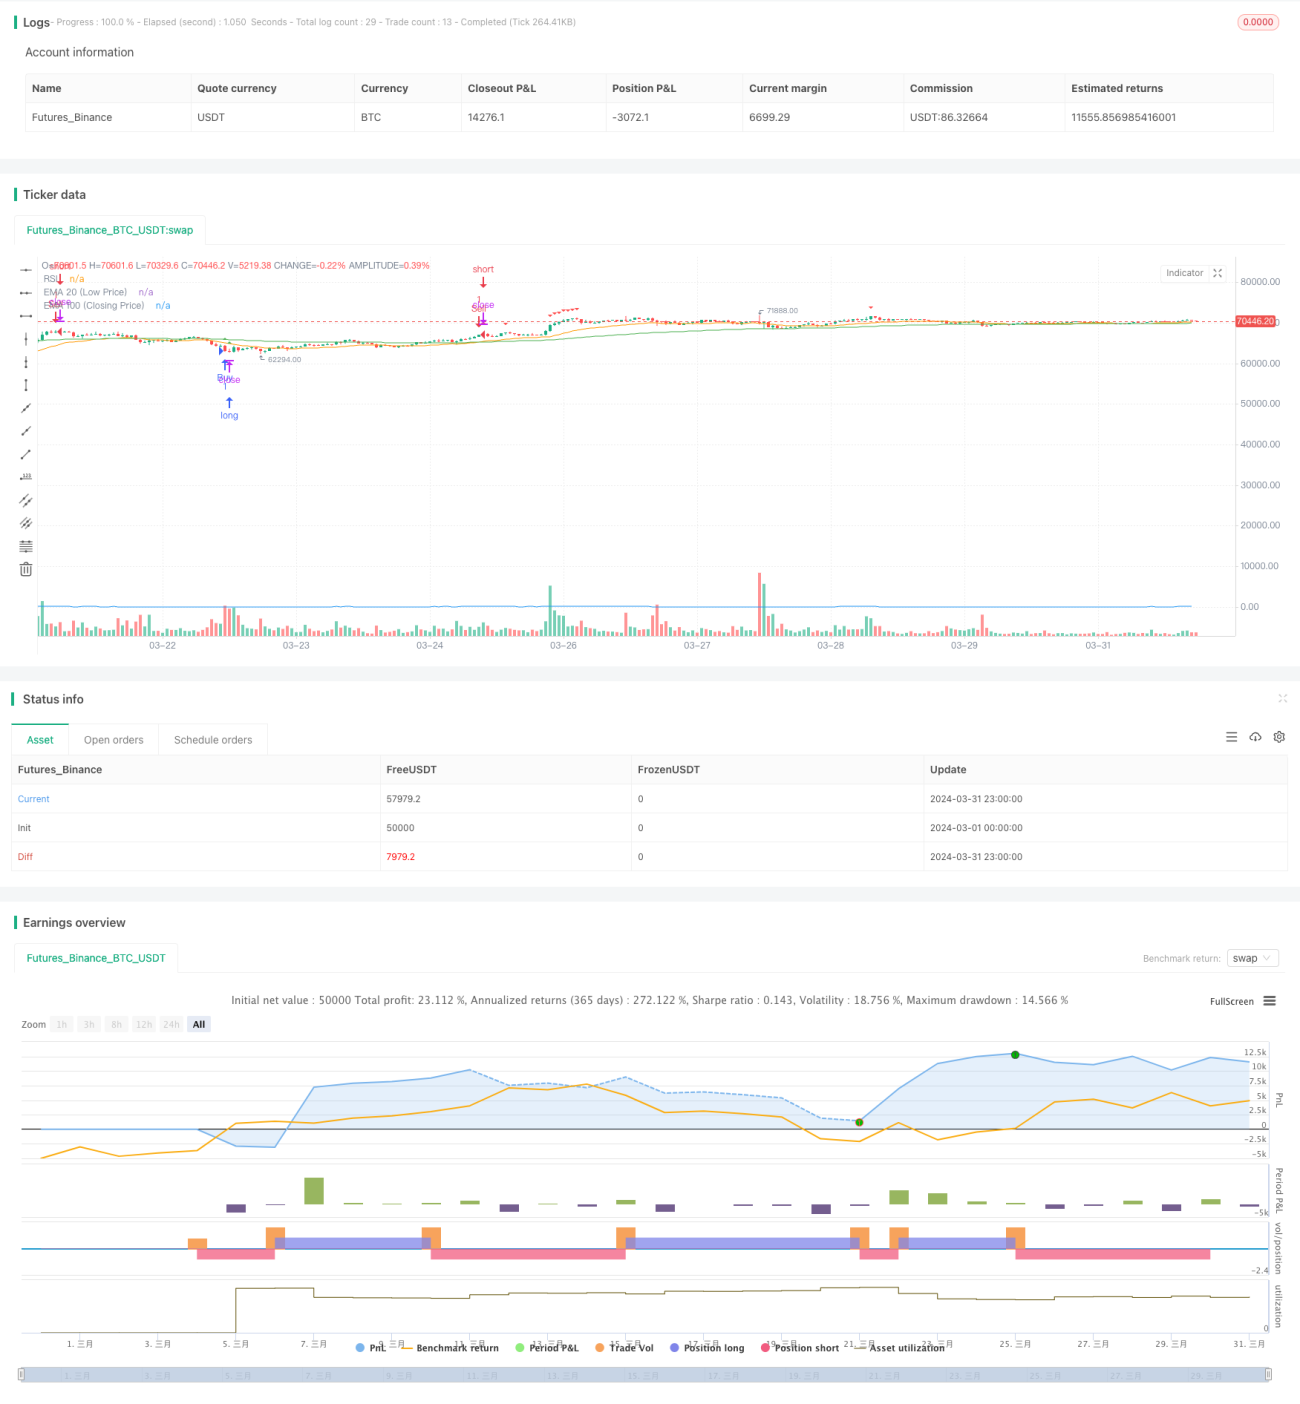
A estratégia baseia-se no indicador RSI e no sinal de cruzamento das duas linhas EMA para determinar o ponto de compra e venda. Quando o preço de fechamento cai abaixo dos EMA100 e EMA20 e o valor do RSI é inferior a 30, o sinal de compra é produzido. Quando o preço de fechamento supera os EMA100 e EMA20 e o valor do RSI é superior a 70, o sinal de venda é produzido.
Princípio da estratégia
- Calcule o valor do indicador RSI para determinar se o mercado está sobrecomprando ou sobrevendendo. Quando o RSI está abaixo de 30, é considerado um intervalo de sobrevenda, e acima de 70 é considerado um intervalo de sobrevenda.
- Calcula-se a linha média entre o EMA100 do preço de fechamento e o EMA20 do preço mínimo, como base para o julgamento da tendência.
- Quando o preço de fechamento cai abaixo da EMA100 e EMA20 e o RSI está abaixo de 30, é considerado um excesso de venda e a tendência é para baixo, gerando um sinal de compra.
- Quando o preço de fechamento ultrapassa a EMA100 e a EMA20 e o RSI é superior a 70, é considerado um excesso de compra e tende para cima, gerando um sinal de venda.
- Comprar quando o sinal é acionado, abrir mais posições e vender quando o sinal é acionado.
Análise de vantagens
- A combinação do RSI com a linha média da EMA permite uma melhor compreensão dos pontos de tendência e dos momentos de sobrevenda e sobrecompra, reduzindo assim os sinais errados.
- Os parâmetros são ajustáveis e podem ser otimizados de acordo com diferentes padrões e períodos, com uma certa adaptabilidade e flexibilidade.
- A lógica é simples, clara, fácil de entender e implementar, sem a necessidade de muita base de análise técnica.
- O Bitcoin é uma ferramenta de negociação de criptomoedas que permite que os investidores e os investidores usem o Bitcoin para capturar os altos e baixos das flutuações e obter ganhos com a diferença de preço.
Análise de Riscos
- Para a tendência unilateral, o mercado pode falhar, e depois da formação da tendência, os sinais errados podem ser produzidos continuamente.
- Parâmetros fixos, falta de capacidade de adaptação dinâmica ao mercado, são vulneráveis a mudanças no ritmo do mercado.
- A frequência de transações em situações de turbulência pode gerar grandes desvios e taxas, afetando os resultados da estratégia.
- A falta de gestão de posições e medidas de controlo de risco, a retirada e a perda máxima são incontroláveis.
Direção de otimização
- Adicionar os critérios de avaliação da tendência, como a passagem MA, DMI, etc., para evitar a entrada prematura na tendência unilateral.
- Otimizar os parâmetros do RSI e do EMA para encontrar a combinação de parâmetros mais adequada para o padrão e o período, aumentando a precisão do sinal.
- A introdução de modelos de gerenciamento de posições, como posições ATR ou fórmula de Kelly, controla a proporção de capital por transação e reduz o risco.
- Configure condições de stop loss e de stop loss, como stop loss de porcentagem fixa ou stop loss móvel, para controlar o máximo de perdas e retorno de lucros em uma única transação.
- Em combinação com outros indicadores auxiliares, como MACD, faixa de Brin, etc., aumenta a confirmação do sinal e reduz o erro de julgamento.
Resumir
A estratégia de quantificação de sinais cruzados RSI e dupla EMA é uma estratégia de negociação quantitativa simples e prática, que pode capturar melhor os altos e baixos em situações de turbulência, combinando o indicador RSI com a linha média EMA, para arbitragem de diferenciais. No entanto, a estratégia também possui algumas limitações e riscos, como falha em situações de tendência, falta de gestão de posição e medidas de controle de risco, etc.
- 1