Estratégia de posição longa RSI50_EMA

Visão geral
A estratégia é chamada de "estratégia de posição longa RSI50_EMA", e a ideia principal é usar os sinais de cruzamento de dois indicadores técnicos, o índice relativamente forte ((RSI) e a média móvel do índice ((EMA)), para tomar decisões comerciais. Quando o preço se move de baixo para cima e quebra a trajetória superior da EMA e o RSI é maior do que 50, a posição é aberta. Quando o preço se move de cima para baixo e quebra a trajetória inferior da EMA ou o RSI cai abaixo de 50 posições.
Princípio da estratégia
- Calcule o EMA e o ATR, obtendo o EMA em andamento.
- Calcule o RSI.
- Quando o preço de fechamento entra em EMA e o RSI é maior do que 50, abra mais.
- Quando o preço de fechamento atravessa a EMA ou o RSI cai abaixo de 50, todos os excedentes são liquidados.
- Faça mais, não menos.
Vantagens estratégicas
- É uma estratégia de mercado forte que permite capturar a tendência de alta de ações fortes.
- Ao mesmo tempo, o uso de dois indicadores, EMA e RSI, permite uma melhor confirmação de sinais de tendência, aumentando a confiabilidade do sinal.
- A administração de posições é feita com um percentual de perda, o risco é controlado.
- A lógica do código é clara, simples, fácil de entender e implementar.
Risco estratégico
- Os mercados em turbulência são propensos a transações frequentes e grandes retrações.
- A escolha incorreta de parâmetros pode causar falha de sinal. Por exemplo, a escolha incorreta do comprimento da EMA pode atrasar o julgamento da tendência. A escolha incorreta do limite superior e inferior do RSI pode levar a pontos de compensação indesejáveis.
- A estratégia só consegue capturar o aumento unilateral, mas não consegue capturar o declínio e a oscilação.
Direção de otimização da estratégia
- A introdução de indicadores de confirmação de tendências, como o MACD, aumentou a precisão do julgamento de tendências.
- Otimizar os parâmetros do RSI ou introduzir sinais de melhoria como o desvio do RSI.
- Considere a adição de travagem móvel ou travagem de taxa de flutuação, melhorando o controle de vento.
- A lógica de reversão de posições pode ser considerada para incluir a lógica de reversão de posições em mercados de baixa e baixa.
Resumir
A estratégia de longo prazo RSI50_EMA é uma estratégia de acompanhamento de tendências simples e fáceis de usar, baseada no RSI e na EMA, adequada para uso em situações de tendência unilateral. A lógica da estratégia é clara, as vantagens são evidentes, mas também existem algumas deficiências e riscos.
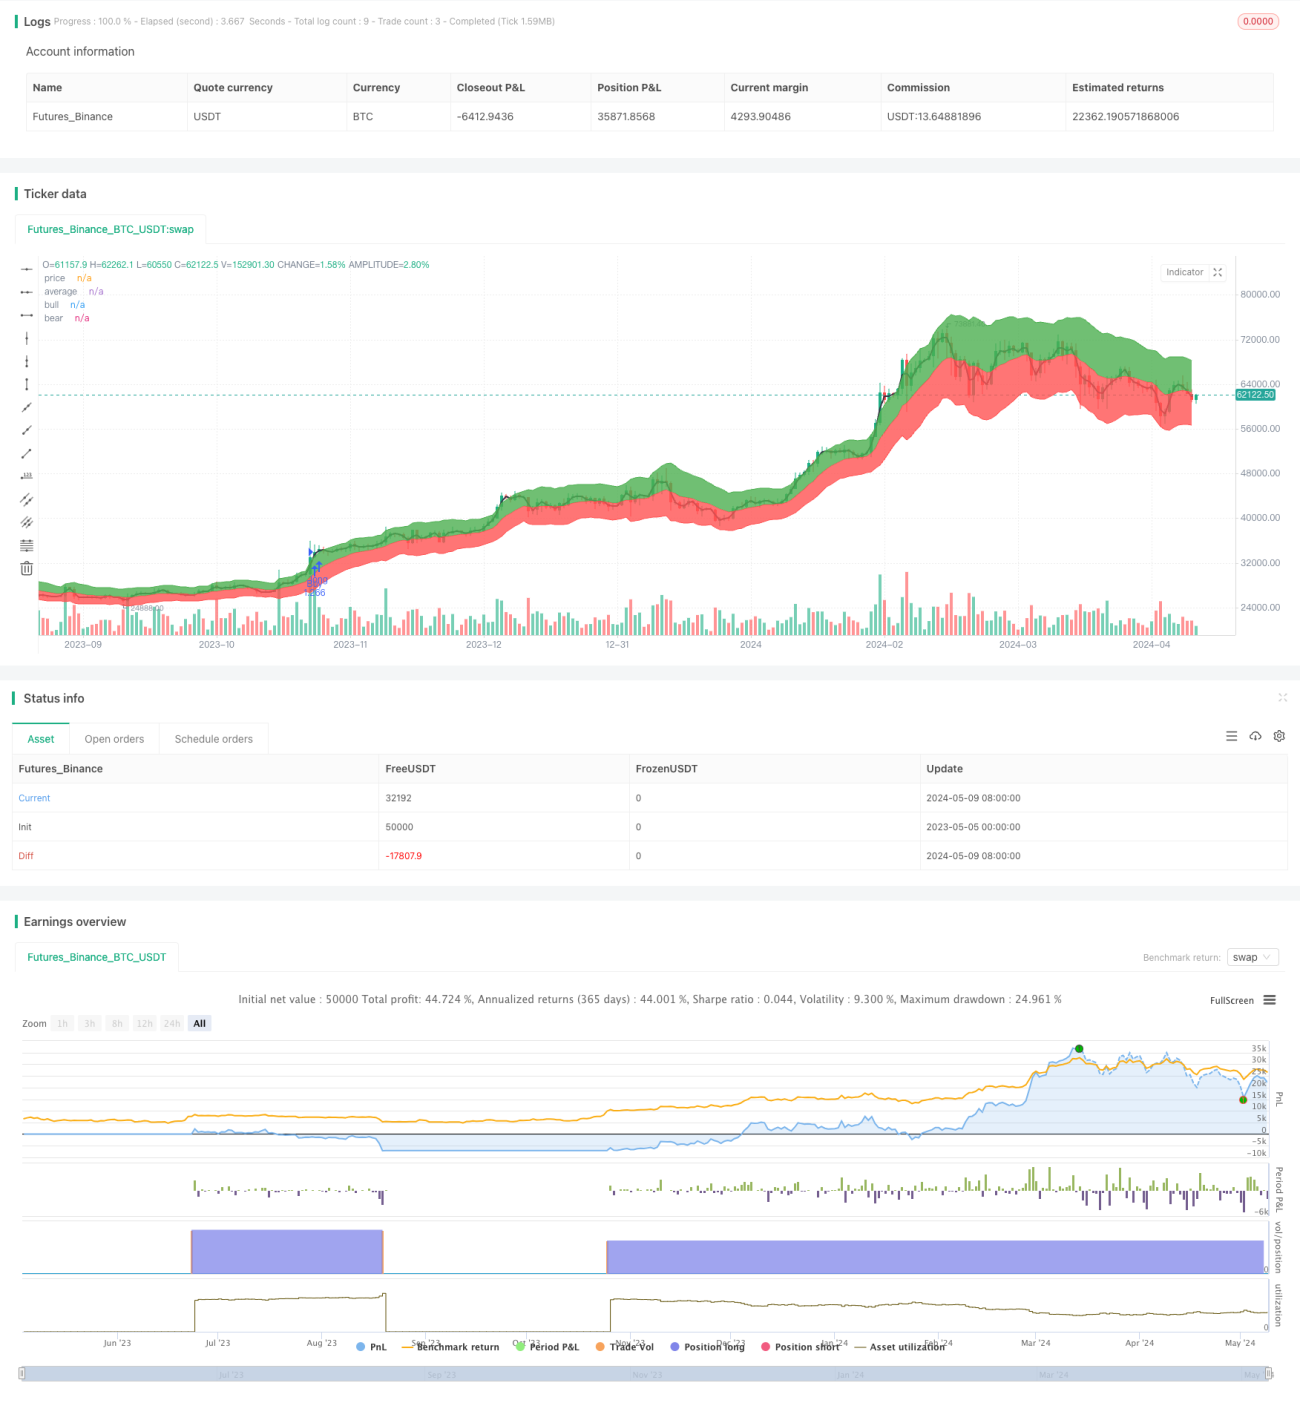
/*backtest
start: 2023-05-05 00:00:00
end: 2024-05-10 00:00:00
period: 1d
basePeriod: 1h
exchanges: [{"eid":"Futures_Binance","currency":"BTC_USDT"}]
*/

//@version=4
strategy("RSI50_EMA Long Only Strategy", overlay=true, default_qty_type=strategy.percent_of_equity, default_qty_value=100)

len = input(11, type=input.integer, minval=1, title="Length")- 1