Estratégia de otimização do mecanismo de mercado longo-curto com base na volatilidade e na linha de regressão

Visão geral
A estratégia utiliza a regressão linear e os indicadores de volatilidade para identificar diferentes estados de mercado e, quando as condições de compra ou venda são satisfeitas, a estratégia estabelece posições correspondentes de hipoteca ou hipoteca. Ao mesmo tempo, a estratégia permite otimizar e ajustar os parâmetros de acordo com a situação do mercado para se adaptar a diferentes ambientes de mercado. A estratégia também usa a média móvel do índice como um indicador adicional para confirmar os sinais de negociação.
Princípio da estratégia
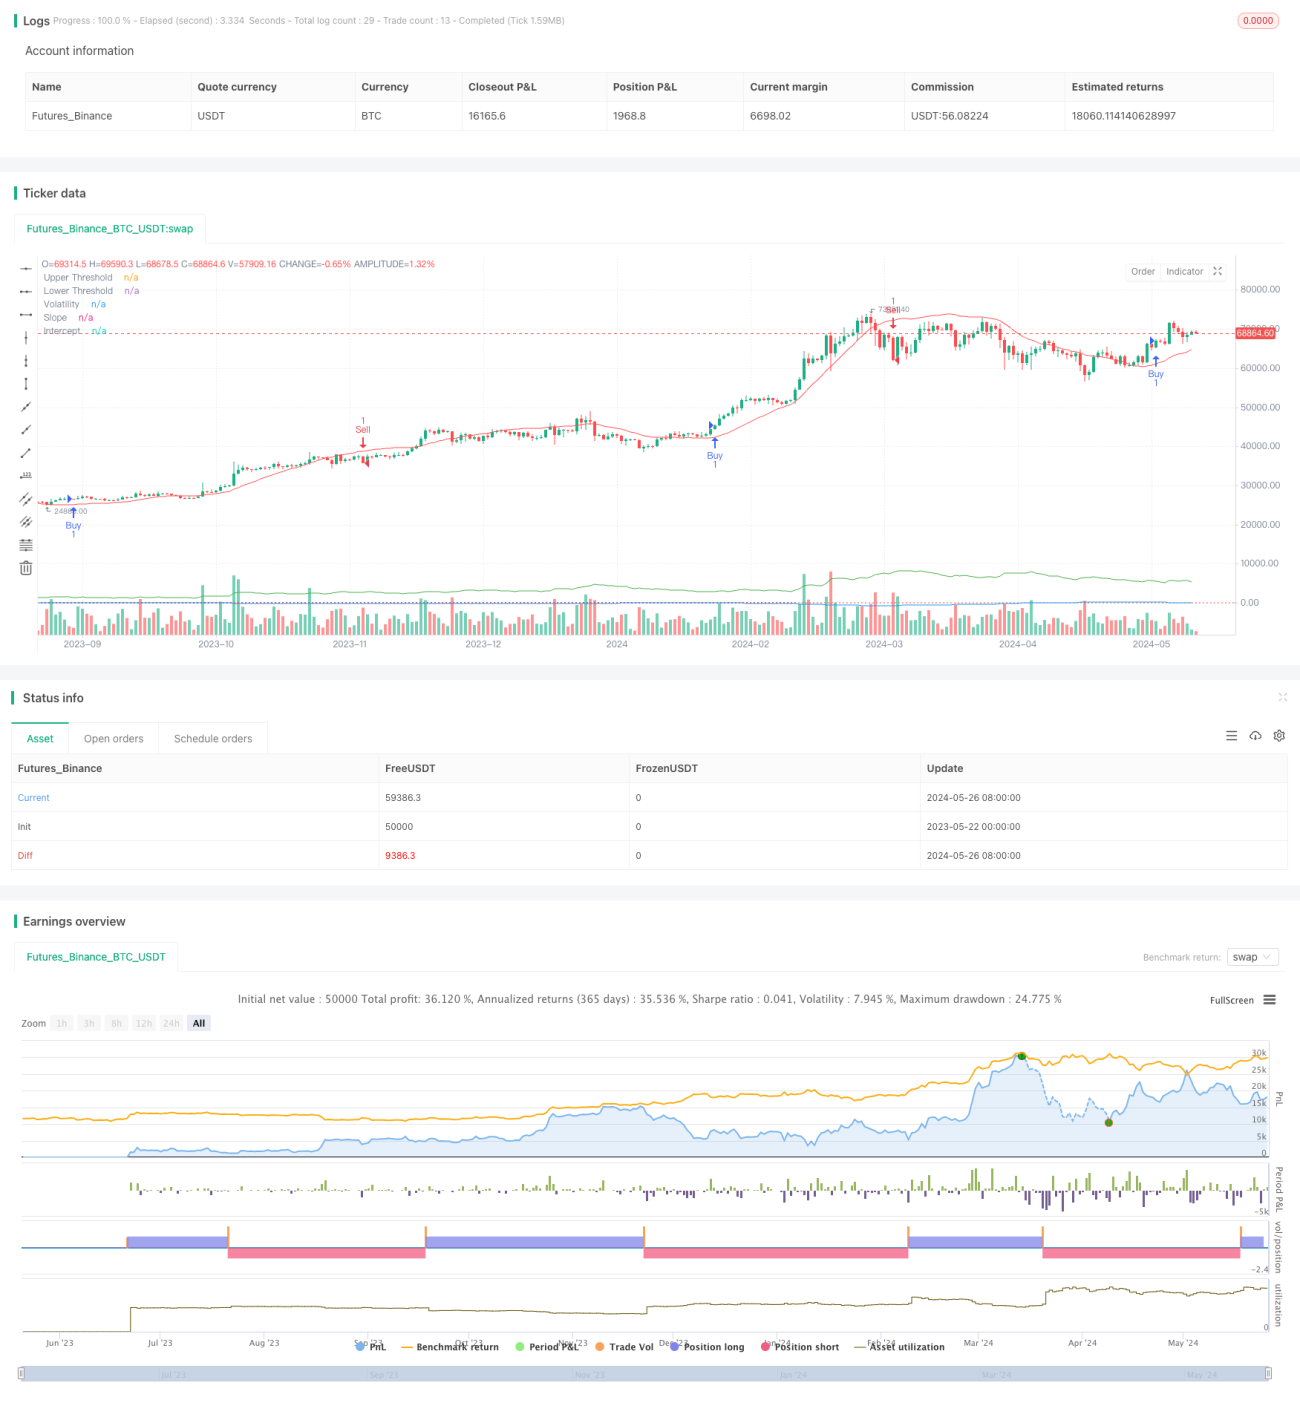
- Calcular o intervalo e a inclinação da regressão linear para determinar a tendência do mercado.
- Calcule a taxa de flutuação real média (ATR) multiplicada por um múltiplo como um indicador de taxa de flutuação.
- Quando a inclinação é maior do que o aumento e o preço é maior do que a linha de retorno mais a flutuação, um sinal de compra é gerado.
- Um sinal de venda é gerado quando a inclinação é menor do que o limiar inferior e o preço é menor do que a linha de retorno menos a flutuação.
- Usando a média móvel rápida e lenta do índice ((EMA) como indicador de confirmação adicional.
- Quando um sinal de compra aparece e o EMA rápido é maior que o EMA lento, estabeleça uma posição múltipla.
- Quando surgir um sinal de venda e o EMA rápido estiver abaixo do EMA lento, estabeleça uma posição em branco.
Vantagens estratégicas
- A combinação de regressão linear e indicadores de volatilidade permite uma identificação mais precisa do estado e da tendência do mercado.
- O uso de indicadores EMA adicionais para confirmar sinais de negociação aumenta a confiabilidade da estratégia.
- Permite a otimização de parâmetros-chave para adaptar-se a diferentes ambientes de mercado e características da variedade.
- Ao mesmo tempo, considerar tendências e volatilidade, pode construir posições em tempo hábil quando a tendência é clara, controlar o risco quando a volatilidade se agrava.
Risco estratégico
- A escolha inadequada de parâmetros pode levar ao fraco desempenho da estratégia, que precisa ser otimizada de acordo com as características específicas da variedade e do mercado.
- A estratégia pode ser usada para evitar a ocorrência de negociações frequentes ou sinais errados em mercados com turbulência ou em pontos de mudança de tendência.
- A estratégia baseia-se em dados históricos e pode não reagir rapidamente a eventos inesperados ou a flutuações anormais do mercado.
Direção de otimização da estratégia
- A introdução de outros indicadores técnicos ou fatores fundamentais para enriquecer a base de decisão estratégica e melhorar a precisão do sinal.
- Optimizar a escolha de parâmetros, tais como a duração da regressão, os múltiplos da taxa de flutuação, o ciclo EMA, etc., para adaptar-se a diferentes variedades e características do mercado.
- Aumentar os mecanismos de stop loss e stop-loss, controlar o risco de cada transação e o nível de retirada geral.
- Considere a inclusão de regras de gerenciamento de posições e de gestão de fundos, ajustando o tamanho das posições de acordo com a flutuação do mercado e o equidade da conta.
Resumir
A estratégia identifica o estado do mercado por meio de regressão linear e indicadores de volatilidade e usa a EMA como indicador de confirmação para construir uma estratégia de negociação adaptável e logicamente clara. A vantagem da estratégia está na combinação de tendências e volatilidade, permitindo a otimização de parâmetros para diferentes ambientes de mercado.
- 1