Estratégia de combinação de supertrend e EMA

Visão geral
A estratégia de combinação de Supertrend e EMA é uma estratégia de negociação que utiliza o indicador Supertrend em combinação com vários EMAs. A estratégia usa o indicador Supertrend para determinar a direção da tendência do mercado atual e, ao mesmo tempo, usa o indicador EMA de diferentes períodos como um sinal de compra. Quando o EMA de curto prazo ocorre em um ponto de interseção com o EMA de médio prazo e o indicador Supertrend mostra uma tendência ascendente, gera um sinal de compra.
Princípio da estratégia
O princípio central da estratégia de combinação de Supertrend e EMA é usar as características do indicador Supertrend e do indicador EMA para capturar as mudanças de tendência do mercado e as flutuações de preços. O indicador Supertrend julga a direção da tendência do mercado atual comparando o preço de fechamento atual com a trajetória ascendente do período anterior. Quando o preço de fechamento supera a trajetória ascendente, o mercado entra em uma tendência ascendente; quando o preço de fechamento supera a trajetória descendente, o mercado entra em uma tendência descendente.
Vantagens estratégicas
- O indicador Supertrend capta com eficiência as mudanças de tendência do mercado, ajudando a estratégia de negociação em consonância com as tendências do mercado.
- Confirmação da EMA múltipla: o uso de indicadores EMA de diferentes períodos como condições de ação de sinais de compra e venda pode aumentar a confiabilidade do sinal e reduzir a ocorrência de falsos sinais.
- Controle de Risco: Com base na tendência do indicador Supertrend, pode-se evitar a negociação em situações adversas e reduzir o risco.
- Adaptabilidade: a estratégia pode ser aplicada a diferentes mercados e variedades, com uma melhor adaptabilidade e flexibilidade.
Risco estratégico
- Risco de otimização de parâmetros: A configuração de parâmetros do indicador Supertrend e do indicador EMA tem um grande impacto no desempenho da estratégia, e os parâmetros inadequados podem levar à falha da estratégia.
- Risco de flutuação do mercado: em situações de forte flutuação do mercado, pode haver frequentes cruzamentos entre EMAs de curto prazo e EMAs de médio prazo, resultando em vários falsos sinais para a estratégia.
- Risco de reversão de tendência: quando a tendência do mercado se reverte, o indicador de Supertrend pode estar atrasado, causando perdas na estratégia no início da reversão de tendência.
Direção de otimização da estratégia
- Optimização de parâmetros: encontrar a melhor combinação de parâmetros, aumentando a estabilidade e a lucratividade da estratégia, através da otimização do múltiplo do indicador Supertrend e do ciclo do indicador EMA.
- Filtragem de sinal: após a geração de sinal de cruzamento EMA, pode ser combinado com outros indicadores técnicos (como RSI, MACD, etc.) para a segunda confirmação do sinal, aumentando a confiabilidade do sinal.
- Stop loss: introdução de um mecanismo de stop loss razoável para controlar o risco de uma única transação e aumentar a taxa de risco-benefício da estratégia.
- Multi-variedade, multi-ciclo: aplicar a estratégia a diferentes variedades e ciclos, reduzindo o risco global por meio de investimentos diversificados.
Resumir
A estratégia de combinação de Supertrend e EMA combina o indicador Supertrend com vários indicadores EMA, formando um sistema de negociação de acompanhamento de tendências completo. A estratégia usa o indicador Supertrend para determinar a tendência do mercado e, ao mesmo tempo, gera sinais de compra e venda através da interseção do indicador EMA, com fortes vantagens de acompanhamento de tendências, confirmação de sinais confiáveis e ampla adaptabilidade.
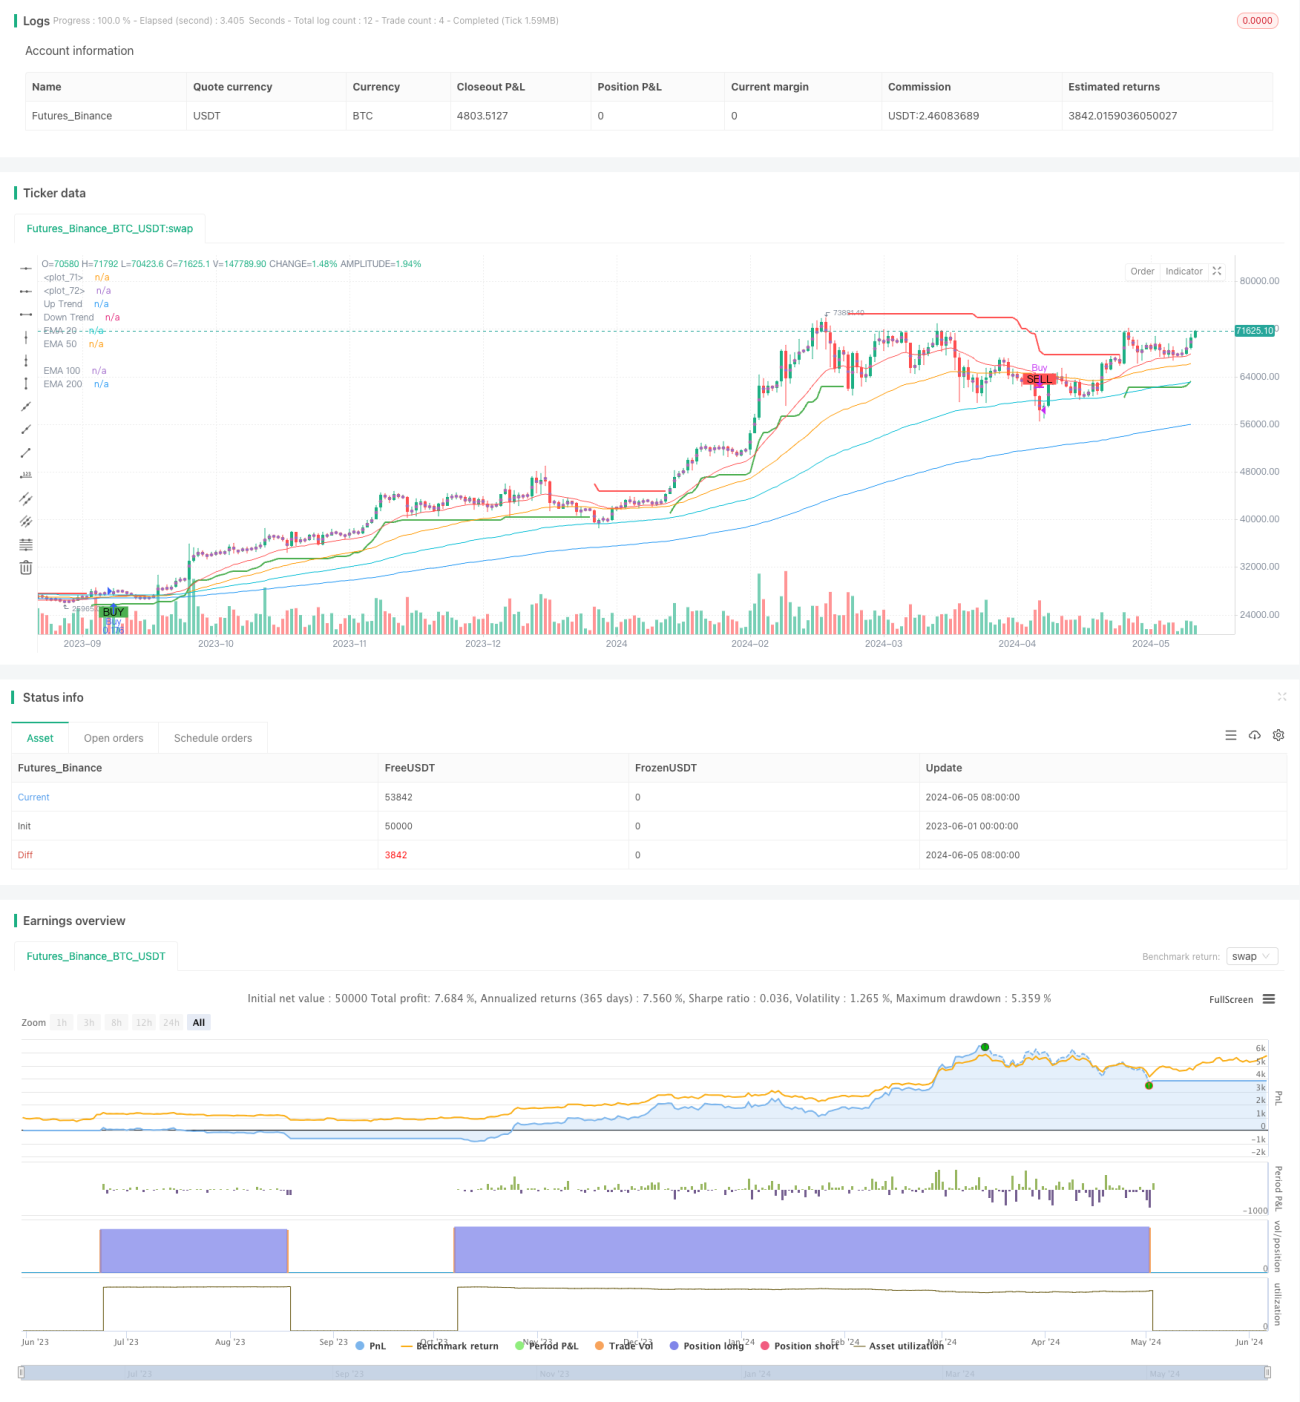
/*backtest
start: 2023-06-01 00:00:00
end: 2024-06-06 00:00:00
period: 1d
basePeriod: 1h
exchanges: [{"eid":"Futures_Binance","currency":"BTC_USDT"}]
*/

//@version=4
strategy("Supertrend EMA Strategy", overlay=true, default_qty_type=strategy.percent_of_equity, default_qty_value=10)

// Supertrend Parameters- 1