Estratégia de negociação inteligente G Trend EMA ATR

Visão geral
Esta estratégia usa o indicador de canal G para identificar a direção da tendência do mercado, combinando os indicadores de EMA e ATR para otimizar os pontos de entrada e saída. A principal idéia da estratégia é: quando o preço quebra o canal G e faz mais na parte inferior do EMA, quebra o canal G e faz mais no topo do EMA.
Princípio da estratégia
- Calcule o trajeto ascendente e descendente do canal G: Calcule o trajeto ascendente e descendente do canal G usando o preço de fechamento atual e o preço mais baixo do preço mais alto anterior.
- Determinar a direção da tendência: Determine a tendência do espaço-tempo observando a relação entre o preço e a ascensão e descensão do canal G.
- Calcular o EMA: calcular o valor do EMA para o período especificado.
- Calcular o ATR: calcular o valor do ATR para o período especificado.
- Para julgar as condições de compra e venda: quando o preço quebra o canal G para cima e está abaixo da EMA, a ação é mais, quando o preço quebra o canal G para baixo e está acima da EMA, a ação é baixa.
- Configuração de stop loss: stop loss é o preço de abertura de posição - 2 vezes o ATR, stop loss é o preço de abertura de posição + 4 vezes o ATR ((multi-cabeça); stop loss é o preço de abertura de posição + 2 vezes o ATR, stop loss é o preço de abertura de posição - 4 vezes o ATR ((cabeça vazia) <unk>
- A estratégia é acionada quando as condições de compra e venda são satisfeitas e a correspondente parada de perda é estabelecida.
Vantagens estratégicas
- Seguimento de tendências: estratégias que utilizam o canal G para capturar as tendências do mercado de forma eficaz e adequada a situações de tendências.
- Stop loss dinâmico: utiliza o ATR dinâmico para ajustar o stop loss, para melhor se adaptar à oscilação do mercado.
- Controle de Risco: O Stop Loss é definido como 2x o ATR e o risco de cada transação é controlado rigorosamente.
- Simples e fácil de usar: a lógica da estratégia é clara e adequada para a maioria dos investidores.
Risco estratégico
- Os sinais de negociação freqüentes podem aumentar os prejuízos em mercados em crise.
- Optimização de parâmetros: diferentes variedades e ciclos podem exigir parâmetros diferentes, e o uso cego pode trazer riscos.
- O evento Black Swan: em casos extremos, a volatilidade dos preços pode ser tão forte que o stop loss pode não ser efetivamente executado.
Direção de otimização da estratégia
- Filtragem de tendências: Aumente as condições de filtragem de tendências, como MA cruzado, DMI, etc., reduzindo a negociação em situações de turbulência.
- Optimização de parâmetros: Optimização de parâmetros para diferentes variedades e ciclos, para encontrar a melhor combinação de parâmetros.
- Gerenciamento de posições: ajustar posições de acordo com a dinâmica de volatilidade do mercado, aumentar a taxa de utilização de fundos.
- Combinação de estratégias: Combinação de estratégias com outras estratégias eficazes para aumentar a estabilidade.
Resumir
A estratégia de construção de um sistema de negociação de tendência de seguimento simples e eficaz através de indicadores como o canal G, EMA, ATR. Pode obter bons resultados em situações de tendência, mas em geral, em situações de turbulência. Posteriormente, a estratégia pode ser otimizada em termos de filtragem de tendência, otimização de parâmetros, gerenciamento de posições e estratégias de combinação para melhorar ainda mais a solidez e a lucratividade da estratégia.
/*backtest
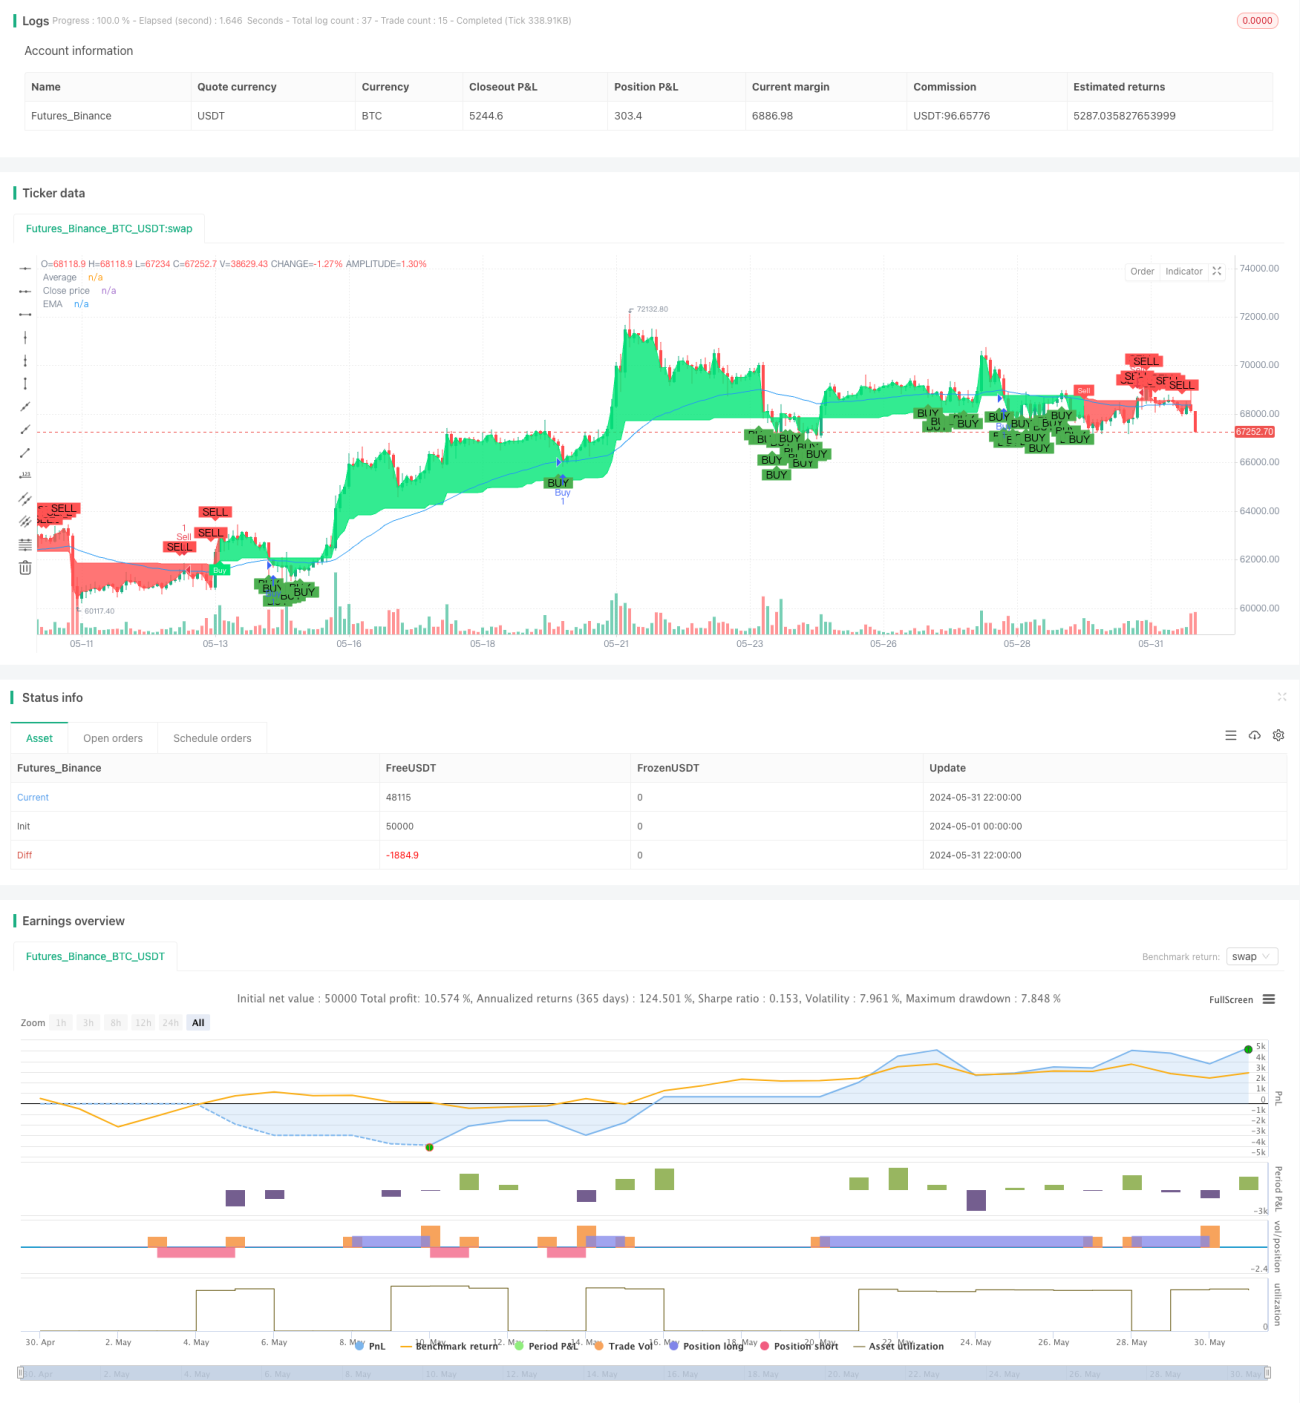
start: 2024-05-01 00:00:00
end: 2024-05-31 23:59:59
period: 2h
basePeriod: 15m
exchanges: [{"eid":"Futures_Binance","currency":"BTC_USDT"}]
*/
//@version=4
// Full credit to AlexGrover: https://www.tradingview.com/script/fIvlS64B-G-Channels-Efficient-Calculation-Of-Upper-Lower-Extremities/
strategy ("G-Channel Trend Detection with EMA Strategy and ATR", shorttitle="G-Trend EMA ATR Strategy", overlay=true)
- 1