
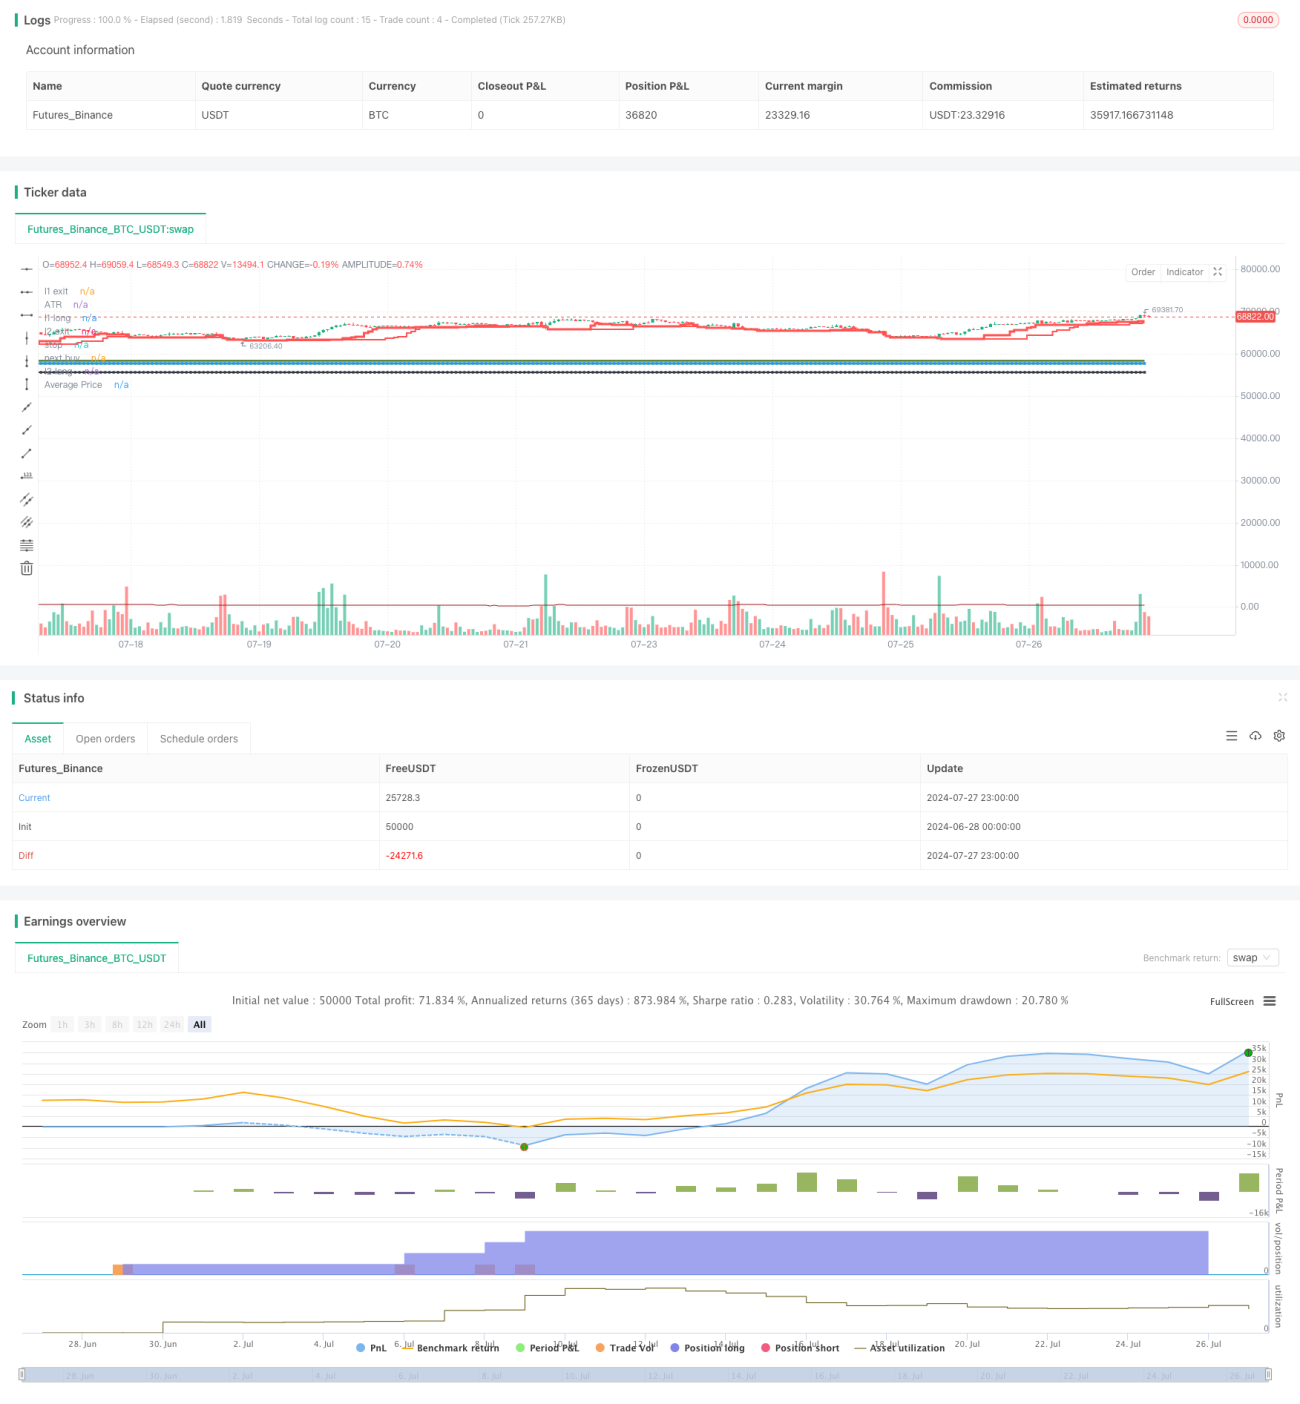
Um sistema de acompanhamento de tendências dinâmicas em vários níveis é uma estratégia de melhoria baseada nas regras de negociação da pirâmide. A estratégia usa sinais de tendência de vários períodos de tempo, combinando paradas dinâmicas e ações de pirâmide, para obter uma visão de tendências de médio e longo prazo. O sistema capta tendências de diferentes velocidades, configurando dois ciclos de acompanhamento de tendências (L1 e L2), e usa indicadores ATR adaptáveis para ajustar dinamicamente as entradas, ações e paradas de perda.
Identificação de tendências: utiliza dois períodos de médias móveis ((L1 e L2) para identificar tendências de diferentes velocidades. A L1 é usada para capturar tendências mais rápidas, enquanto a L2 é usada para capturar tendências mais lentas, mas mais confiáveis.
Sinal de entrada: quando o preço ultrapassa o L1 ou o L2, um sinal de multiplicação é gerado. Se a última transação L1 for lucrativa, salte o próximo sinal L1 até o sinal L2 aparecer.
Stop loss dinâmico: usando o múltiplo do ATR (default 3x) como a distância de stop loss inicial, o ponto de stop loss irá gradualmente subir com o aumento do tempo de detenção.
Aumento de posição da pirâmide: durante a continuação da tendência, a cada aumento de 0,5 ATR, a posição é aumentada, no máximo, 5 vezes.
Controle de risco: o risco de cada transação não excede 2% do valor líquido da conta, através do cálculo dinâmico do volume de posse.
Mecanismo de saída: Separação quando o preço cai abaixo da 10a baixa ((L1) ou da 20a baixa ((L2), ou quando a linha de parada móvel é acionada.
Captura de tendências em vários níveis: através de dois ciclos L1 e L2, pode-se capturar tendências rápidas e captar tendências de longo prazo, aumentando a adaptabilidade e a estabilidade da estratégia.
Gerenciamento de risco dinâmico: o uso do ATR como um indicador de volatilidade, permite o ajuste dinâmico de posições de entrada, parada e acréscimo, melhor adaptando-se às mudanças do mercado.
A pirâmide de posicionamento: Aposentar gradualmente enquanto a tendência se mantém, tanto para controlar o risco quanto para maximizar o potencial de lucro.
Parâmetros flexíveis: vários parâmetros ajustáveis permitem que a estratégia se adapte a diferentes mercados e estilos de negociação.
Execução automática: a estratégia pode ser totalmente automatizada, reduzindo a intervenção humana e o impacto emocional.
Risco de reversão de tendência: Performance excelente em mercados de forte tendência, mas em mercados de turbulência, a possibilidade de negociação frequente pode levar a perdas.
Ponto de deslizamento e custos de transação: o aumento frequente de posições e o stop loss móvel podem levar a custos de transação mais elevados.
Risco de otimização excessiva: há muitos parâmetros que podem levar a excesso de correspondência com os dados históricos.
Risco de gerenciamento de capital: se o capital inicial for pequeno, pode não ser possível executar com eficácia várias adições de risco.
Risco de liquidez de mercado: em mercados com pouca liquidez, pode ser difícil executar transações de acordo com o preço ideal.
Introdução de filtros de cenário de mercado: pode-se adicionar indicadores de intensidade de tendência (como o ADX) para julgar o cenário de mercado, reduzindo a frequência de negociação em mercados turbulentos.
Optimizar a estratégia de alavancagem: pode-se considerar o ajuste dinâmico do intervalo e da frequência de alavancagem de acordo com a intensidade da tendência, em vez de um ATR fixo de 0,5 e 5 vezes.
Introdução de um mecanismo de stop-loss: durante a tendência de longo prazo, pode-se definir um stop-loss parcial para bloquear os lucros, como a eliminação de metade da posição quando se atinge um lucro de 3 vezes o ATR.
Análise de correlação entre variedades: quando aplicado em combinação, a análise de correlação entre variedades pode ser adicionada para otimizar a relação de risco-benefício geral.
Adição de filtros de volatilidade: durante períodos de alta volatilidade, pode-se suspender a negociação ou ajustar os parâmetros de risco para responder a mercados anormais.
Otimização do mecanismo de saída: pode-se considerar o uso de indicadores de saída mais flexíveis, como o parabolic SAR ou o Chandelier Exit.
O sistema de acompanhamento de tendências dinâmicas em níveis múltiplos é uma estratégia abrangente que combina as regras clássicas de negociação de correntes e as tecnologias modernas de quantificação. Através de métodos como a identificação de tendências em níveis múltiplos, o gerenciamento de riscos dinâmicos e o levantamento de posições em pirâmide, a estratégia aumenta a capacidade de captação de tendências e o potencial de lucro, enquanto mantém a estabilidade. Embora seja desafiada em mercados turbulentos, a estratégia espera manter um desempenho estável em diferentes ambientes de mercado através da otimização de parâmetros e controle de risco razoáveis.
/*backtest
start: 2024-06-28 00:00:00
end: 2024-07-28 00:00:00
period: 1h
basePeriod: 15m
exchanges: [{"eid":"Futures_Binance","currency":"BTC_USDT"}]
*/
//@version=5
// This is a strategy based on the famous turtle system.
// https://www.tradingblox.com/originalturtles/originalturtlerules.htm
//
// In a nutshell, it a trend trading system where you are buying on strength, selling on weakness.
// positions should be entered when the price crosses over the 20-day high (L1 high) or 55-day high (L2 high).
// positions should be exited when the prices crosses below the 10-day low (L1 low) or 20-day low (L2 low)
// you can add positions at every unit (measured by multiple of n, where n=1 ATR)
// stops should be placed at 2*n below every position entered, when the stop is hit exit your entire position.
// positions should be entered everytime price crosses over L1 or L2, with one exception:
// if the last trade was an L1 trade and it was a winning trade, skip the next trade unless the price crosses
// over L2, if that is the case, you should take it.
// L1 and L2 levels are also configurable for high and lows.
// N multiple for stops and pyramid are also configurable
// To change this from a strategy to a study:
// 1) uncomment the next line and comment out the strategy line.
// 2) at the end of the file comment out the last 2 lines
// study(title="Turtle Study", overlay=true)
strategy(title='kTF-VNI', overlay=true, initial_capital=100000000, commission_type=strategy.commission.percent, commission_value=0.0, pyramiding=100, process_orders_on_close=true, calc_on_every_tick=true)
stopInput = input.float(3, 'Stop N', step=.05)
riskPercent = input.float(.01, 'Risk % of capital', step=.005)
pyramidInput = input.float(0.5, 'Pyramid N', step=.05)
maxUnits = input.int(5, 'Max Pyramid Units', step=1)
atrPeriod = input(20, 'ATR period')
l1LongInput = 10
l2LongInput = 20
l1LongExitInput = 20
l2LongExitInput = 40
l1LongInput := input.int(20, 'L1 Long', minval=2)
l2LongInput := input.int(60, 'L2 Long', minval=2)
l1LongExitInput := input.int(10, 'L1 Long Exit', minval=2)
l2LongExitInput := input.int(20, 'L2 Long Exit', minval=2)
FromYear = input.int(1970, 'From Year', minval=1900)
FromMonth = input.int(1, 'From Month', minval=1, maxval=12)
FromDay = input.int(1, 'From Day', minval=1, maxval=31)
ToYear = input.int(9999, 'To Year', minval=1900)
ToMonth = input.int(1, 'To Month', minval=1, maxval=12)
ToDay = input.int(1, 'To Day', minval=1, maxval=31)
FromDate = timestamp(FromYear, FromMonth, FromDay, 00, 00)
ToDate = timestamp(ToYear, ToMonth, ToDay, 23, 59)
TradeDateIsAllowed() =>
time >= FromDate and time <= ToDate
l1Long = ta.highest(l1LongInput)
l1LongExit = ta.lowest(l1LongExitInput)
l2Long = ta.highest(l2LongInput)
l2LongExit = ta.lowest(l2LongExitInput)
bool win = false // tracks if last trade was winning trade of losing trade.
float buyPrice = 0.0 // tracks the buy price of the last long position.
float nextBuyPrice = 0.0 // tracks the next buy price
float stopPrice = na // tracks the stop price
int totalBuys = 0 // tracks the total # of pyramid buys
bool inBuy = false // tracks if we are in a long position or not.
float l1LongPlot = ta.highest(l1LongInput) // tracks the L1 price to display
float l2LongPlot = ta.highest(l2LongInput) // tracks the L2 price to display
float n = ta.atr(atrPeriod) // tracks the n used to calculate stops and pyramid buys
string mode = 'L1' // tracks whether we are in a L1 position or L2 position.
bool fake = na // tracks if this is a fake trade, see comments below.
string longLevel = na // tracks where long positions, stops, pyramid buys occur.
float capitalLeft = strategy.initial_capital
var shares = 0
float fakeBuyPrice = 0.0
// by default use the last value from the previous bar.
buyPrice := buyPrice[1]
totalBuys := totalBuys[1]
nextBuyPrice := nextBuyPrice[1]
stopPrice := stopPrice[1]
win := win[1]
capitalLeft := capitalLeft[1]
inBuy := inBuy[1]
n := ta.atr(atrPeriod)
fakeBuyPrice := fakeBuyPrice[1]
// State to track if we are in a long positon or not.
if not inBuy[1] and (high > l1Long[1] or high > l2Long[1])
inBuy := true
inBuy
else
inBuy := inBuy[1] and low < stopPrice[1] ? false : inBuy
inBuy := inBuy[1] and mode[1] == 'L1' and low < l1LongExit[1] ? false : inBuy
inBuy := inBuy[1] and mode[1] == 'L2' and low < l2LongExit[1] ? false : inBuy
inBuy
// State to track if we are ia a fake trade. If the last trade was a winning, we need to skip the next trade.
// We still track it though as a fake trade (not counted against us). as the outcome determines if we can
// can take the next trade.
if not inBuy[1] and high > l1Long[1] and win[1]
fake := true
fakeBuyPrice := close
fakeBuyPrice
else
fake := fake[1]
fake
if fake[1] and inBuy[1] and not inBuy
fake := false
win := close >= fakeBuyPrice
win
fake := high > l2Long[1] ? false : fake
// Series representing the l1 and l2 levels. If we break out above the l1 or l2 level, we want the
// line to stay at the breakout level, not follow it up.
l1LongPlot := not inBuy[1] or inBuy[1] and mode == 'L1' and fake[1] ? l1Long[1] : l1LongPlot[1]
l2LongPlot := not inBuy[1] or inBuy[1] and mode == 'L1' and fake[1] ? l2Long[1] : l2LongPlot[1]
// Variable in the series is only set when it happens. Possible values is L1, L2, SR
// (stopped out with a loss), SG (exited with a gain), and 'P' for pyramid buy.
longLevel := not inBuy[1] and high > l1Long[1] ? 'L1' : na
longLevel := (not inBuy[1] or inBuy[1] and fake[1]) and high > l2Long[1] ? 'L2' : longLevel
// Either 'L1' or 'L2' depending on what breakout level we are in.
mode := longLevel == na ? mode[1] : longLevel
// Variables to track calculating nextBuyPrice for pyramiding.
if longLevel == 'L1' or longLevel == 'L2'
buyPrice := close
totalBuys := 1
stopPrice := close - stopInput * n
nextBuyPrice := close + pyramidInput * n
nextBuyPrice
// Marks if we hit our next buy price, if so mark it with a 'P'
longLevel := longLevel == na and inBuy[1] and high > nextBuyPrice and TradeDateIsAllowed() and totalBuys < maxUnits ? 'P' : longLevel
if longLevel == 'P'
buyPrice := close
totalBuys := totalBuys[1] + 1
stopPrice := close - stopInput * n
nextBuyPrice := close + pyramidInput * n
nextBuyPrice
// Tracks stops and exits, marking them with SG or SR
longLevel := longLevel == na and inBuy[1] and low < stopPrice and close >= strategy.position_avg_price ? 'SG' : longLevel
longLevel := longLevel == na and inBuy[1] and low < stopPrice and close < strategy.position_avg_price ? 'SR' : longLevel
longLevel := longLevel == na and mode[1] == 'L1' and inBuy[1] and low < l1LongExit[1] and close >= strategy.position_avg_price ? 'SG' : longLevel
longLevel := longLevel == na and mode[1] == 'L2' and inBuy[1] and low < l2LongExit[1] and close >= strategy.position_avg_price ? 'SG' : longLevel
longLevel := longLevel == na and mode[1] == 'L1' and inBuy[1] and low < l1LongExit[1] and close < strategy.position_avg_price ? 'SR' : longLevel
longLevel := longLevel == na and mode[1] == 'L2' and inBuy[1] and low < l2LongExit[1] and close < strategy.position_avg_price ? 'SR' : longLevel
// Tracks if the trade was a win or loss.
win := longLevel == 'SG' ? true : win
win := longLevel == 'SR' ? false : win
// Variables used to tell strategy when to enter/exit trade.
//plotarrow(fake ? 1 : 0, colordown=color.red, colorup=color.purple, transp=40) // down arrow for winning trade
enterLong = (longLevel == 'L1' or longLevel == 'L2' or longLevel == 'P') and not fake and TradeDateIsAllowed()
exitLong = (longLevel == 'SG' or longLevel == 'SR') and not fake and TradeDateIsAllowed()
p1 = plot(l1LongPlot, title='l1 long', linewidth=3, style=plot.style_stepline, color=color.new(color.green, 0))
p2 = plot(l1LongExit[1], title='l1 exit', linewidth=3, style=plot.style_stepline, color=color.new(color.red, 0))
p3 = plot(l2LongPlot, title='l2 long', linewidth=2, style=plot.style_stepline, color=color.new(color.green, 0))
p4 = plot(l2LongExit[1], title='l2 exit', linewidth=2, style=plot.style_stepline, color=color.new(color.red, 0))
color1 = color.new(color.black, 0)
color2 = color.new(color.black, 100)
col = inBuy ? color1 : color2
p5 = plot(stopPrice, title='stop', linewidth=2, style=plot.style_circles, join=true, color=color.new(color.black, 0))
p6 = plot(nextBuyPrice, title='next buy', linewidth=2, style=plot.style_circles, join=true, color=color.new(color.blue, 0))
fill(p1, p3, color=color.new(color.green, 90))
fill(p2, p4, color=color.new(color.red, 90))
risk = (strategy.initial_capital + strategy.netprofit) * riskPercent
shares := math.floor(risk / (stopInput * n))
capitalLeft := strategy.initial_capital + strategy.netprofit - strategy.position_size * strategy.position_avg_price
if shares * close > capitalLeft
shares := math.max(0, math.floor(capitalLeft / close))
shares
shares := math.max(0, shares)
plotshape(longLevel == 'L1' and not fake and strategy.position_size == 0 ? true : false, color=color.new(color.green, 40), style=shape.triangleup, text='L1 ') // up arrow for entering L1 trade
plotshape(not fake[1] and fake and longLevel == 'L1' and strategy.position_size == 0 ? true : false, color=color.new(color.gray, 40), style=shape.triangleup, text='L1') // up arrow for entering L1 trade
plotshape(longLevel == 'L2' and strategy.position_size == 0 ? true : false, color=color.new(color.green, 40), style=shape.triangleup, text='L2') // up arrow for entering L2 trade
plotshape((mode == 'L1' or mode == 'L2') and shares > 0 and enterLong and strategy.position_size > 0 ? true : false, color=color.new(color.green, 40), style=shape.triangleup, text='P')
plotarrow(strategy.position_size == 0 and longLevel == 'L1' and enterLong ? 1 : 0, colordown=color.new(color.black, 40), colorup=color.new(color.green, 40)) // up arrow for entering L1 trade
plotarrow(strategy.position_size == 0 and longLevel == 'L2' and enterLong ? 1 : 0, colordown=color.new(color.black, 40), colorup=color.new(color.green, 40)) // up arrow for entering L2 trade
plotarrow(strategy.position_size > 0 and longLevel == 'SR' and exitLong ? -1 : 0, colordown=color.new(color.red, 40), colorup=color.new(color.purple, 40)) // down arrow for losing trade
plotarrow(strategy.position_size > 0 and longLevel == 'SG' and exitLong ? -1 : 0, colordown=color.new(color.green, 40), colorup=color.new(color.purple, 40)) // down arrow for winning trade
plotshape(longLevel == na and inBuy[1] and not inBuy, color=color.new(color.gray, 40), style=shape.triangleup, text='Exit') // up arrow for entering L1 trade
plot(ta.atr(atrPeriod), title='ATR', color=color.new(#991515, 0))
plot(strategy.position_avg_price, title='Average Price', color=color.new(#991515, 0))
alertcondition(low < stopPrice, title='crosses under stop price', message='price crossed under stop price')
alertcondition(high > l1Long, title='crosses over L1 price', message='price crossed over L1 price')
alertcondition(high > l2Long, title='crosses over L2 price', message='price crossed over L2 price')
alertcondition(low < l1LongExit, title='crosses under L1 exit price', message='price crossed under L1 exit price')
alertcondition(low < l2LongExit, title='crosses under L2 exit price', message='price crossed under L2 exit price')
strategy.entry('long', strategy.long, qty=shares, comment='long', when=enterLong)
strategy.close('long', when=exitLong)
// simulate_amount = 100000
// simulate_risk = simulate_amount*0.005
// simulate_shares = floor(simulate_risk/(n*stopInput))
// plot(simulate_shares, "Shares", color=#991515, transp=0)
// if (enterLong)
// label.new(bar_index, high, text=tostring(simulate), style=label.style_none)