Estratégias de negociação que combinam análise técnica multiperíodo com sentimento de mercado

Visão geral
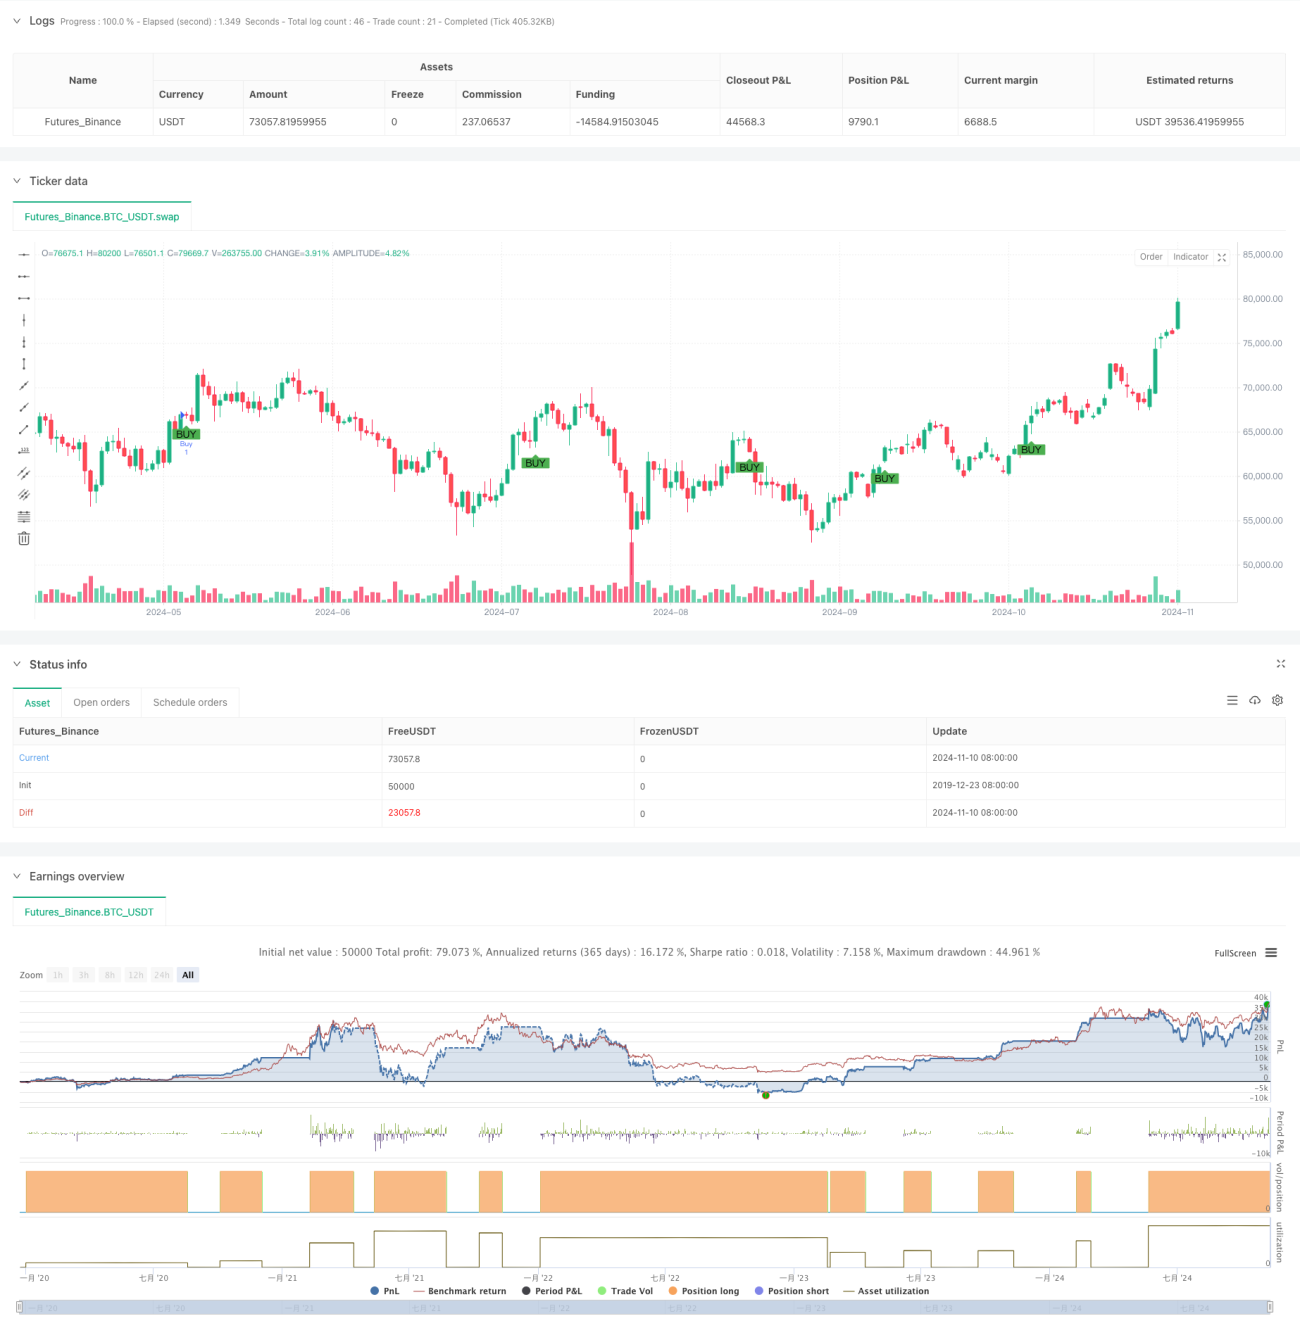
A estratégia é um sistema de negociação integrado que combina vários indicadores técnicos e a emoção do mercado. O núcleo da estratégia usa sinais cruzados de médias móveis de curto e longo prazo (SMA) em combinação com o indicador MACD para confirmar a direção da tendência.
Princípio da estratégia
A estratégia funciona com base nos seguintes componentes centrais:
- Sistema de média móvel multi-período: determinação de tendências usando SMAs de 10 e 30 períodos
- Indicador MACD: configuração com parâmetros padrão ((12, 26, 9) para confirmação de tendências
- Monitoramento do sentimento do mercado: o indicador RSI para o julgamento de sobrecompra e sobrevenda
- Reconhecimento de forma de gráfico: sistema de reconhecimento automático que inclui formas de topo/base duplo e topo de cabeça e ombro
- Filtragem por tempo: oportunidades de negociação focadas em períodos de tempo específicos
- Identificação de pontos de resistência: uso de 20 ciclos de retrocesso para determinar os principais pontos de resistência
As condições de compra devem ser preenchidas: estar no momento de negociação do alvo, usar o SMA de curto prazo no SMA de longo prazo e o indicador MACD mostrar um sinal de múltiplas cabeças.
As condições de venda devem ser cumpridas: o preço atinge o principal nível de resistência e o indicador MACD mostra um sinal de cabeça vazia.
Vantagens estratégicas
- Confirmação de sinal multidimensional: combinação de indicadores técnicos e formato gráfico para aumentar a confiabilidade do sinal de negociação
- Gestão de risco perfeita: Incluindo mecanismos de saída antecipada baseados em RSI
- Integração do sentimento do mercado: julgar o sentimento do mercado com o indicador RSI, evitando a busca excessiva de queda e queda
- Identificação automática de formas: reduzir a distorção de julgamentos subjetivos
- Filtragem de tempo: focalização nos momentos de maior atividade do mercado para melhorar a eficiência das transações
Risco estratégico
- Sensibilidade de parâmetros: configurações de parâmetros de vários indicadores técnicos podem afetar o desempenho da política
- Risco de atraso: a média móvel e o MACD têm um certo atraso
- Precisão de reconhecimento de forma: sistemas de reconhecimento automático podem ter erros de julgamento
- Dependência do cenário do mercado: Falso sinal pode ser frequente em mercados turbulentos
- Limites de tempo: oportunidades que podem ser perdidas em outros períodos de tempo, mas que só podem ser negociadas em determinados períodos de tempo
Direção de otimização da estratégia
- Adaptação de parâmetros: introdução de um mecanismo de ajuste de parâmetros de adaptação, ajustando automaticamente os parâmetros do indicador de acordo com a volatilidade do mercado
- Sistema de peso de sinais: estabelecer um sistema de peso de sinais de indicadores para melhorar a precisão da decisão
- Optimização de Stop Loss: aumentar o mecanismo de Stop Loss dinâmico e aumentar a capacidade de controle de risco
- Reforço de reconhecimento de forma: introdução de algoritmos de aprendizagem de máquina para melhorar a precisão de reconhecimento de forma de gráficos
- Extensão do ciclo de retorno: retorno em diferentes ciclos de mercado para verificar a estabilidade da estratégia
Resumir
Trata-se de uma estratégia de negociação mais abrangente, que combina vários indicadores técnicos e sentimentos de mercado para criar um sistema de negociação relativamente completo. A vantagem da estratégia reside na detecção de sinais multidimensional e no mecanismo de gerenciamento de risco perfeito, mas também há problemas como sensibilidade de parâmetros e precisão de identificação de formas.
- 1