Visão geral
Este artigo apresenta um sistema de negociação de acompanhamento de tendências que combina a caixa de Darvas e a média móvel de 25 períodos. A estratégia identifica as caixas que se formam entre os intervalos de parada de preços e, em combinação com a confirmação de tendências equilíneas, capta a força no momento da ruptura. O design do sistema considera a continuidade da tendência e o filtro de falsa ruptura, fornecendo aos comerciantes uma estrutura completa de entrada e saída do mercado.
Princípio da estratégia
A estratégia tem três componentes principais:
- Construção da caixa de Davos: o sistema determina a fronteira da caixa, calculando os preços mais altos e mais baixos dos últimos 5 ciclos. A parte superior da caixa é determinada pelo novo ponto mais alto e a parte inferior pelo ponto mais baixo dentro do intervalo correspondente.
- Confirmação de tendência de linha média: introdução de uma média móvel simples de 25 períodos como filtro de tendência, apenas considerando a abertura de posições quando o preço estiver acima de MA25.
- Geração de sinais de transação:
- Sinais de compra: o preço ultrapassa o topo da caixa e está acima da MA25
- Sinais de venda: Preço cai para o fundo da caixa
Vantagens estratégicas
- O Facebook é um dos principais canais de comunicação do mundo.
- Começou a tendência de capturar através de “break-through”
- Combinação com filtragem MA25 para garantir negociação na direção da tendência principal
- Qualidade do sinal:
- Mecanismos de dupla confirmação reduzem o risco de brechas falsas
- Condições claras de entrada e saída, evitando julgamentos subjetivos
- O risco é controlado:
- Ponto de parada natural na parte inferior da caixa
- MA25 oferece proteção adicional contra tendências
Risco estratégico
- Riscos de um mercado em choque:
- Percussões frequentes podem levar a perdas contínuas
- Recomendado em mercados de forte tendência
- Risco de atraso:
- A formação da caixa leva tempo e pode ter falhado em algumas coisas.
- MA25 como média intermédia com um certo atraso
- Riscos de gestão de fundos:
- A necessidade de estabelecer uma proporção razoável de capital para cada transação
- Recomendação de ajuste de posição em combinação com a volatilidade
Direção de otimização da estratégia
- Parâmetros de otimização:
- O ciclo do casco pode ser ajustado de acordo com diferentes características do mercado
- O ciclo MA pode ser ajustado de acordo com as características do ciclo do mercado
- Aumentar o sinal:
- Mecanismo de confirmação de entrega adicionável
- Considerar a introdução de um mecanismo de stop loss dinâmico
- Controle de risco reforçado:
- Adicionar filtro de volatilidade
- Realize o gerenciamento dinâmico de posições
Resumir
A estratégia combina a clássica teoria do caixão de Davos e o acompanhamento de tendências de médias móveis para construir um sistema de negociação robusto. A principal vantagem do sistema é a capacidade de capturar efetivamente os comportamentos tendenciais e, ao mesmo tempo, controlar o risco por meio de múltiplos mecanismos de filtragem. Embora haja um certo atraso, a estratégia consegue obter um desempenho estável em mercados de tendências por meio de uma racional otimização de parâmetros e gerenciamento de risco.
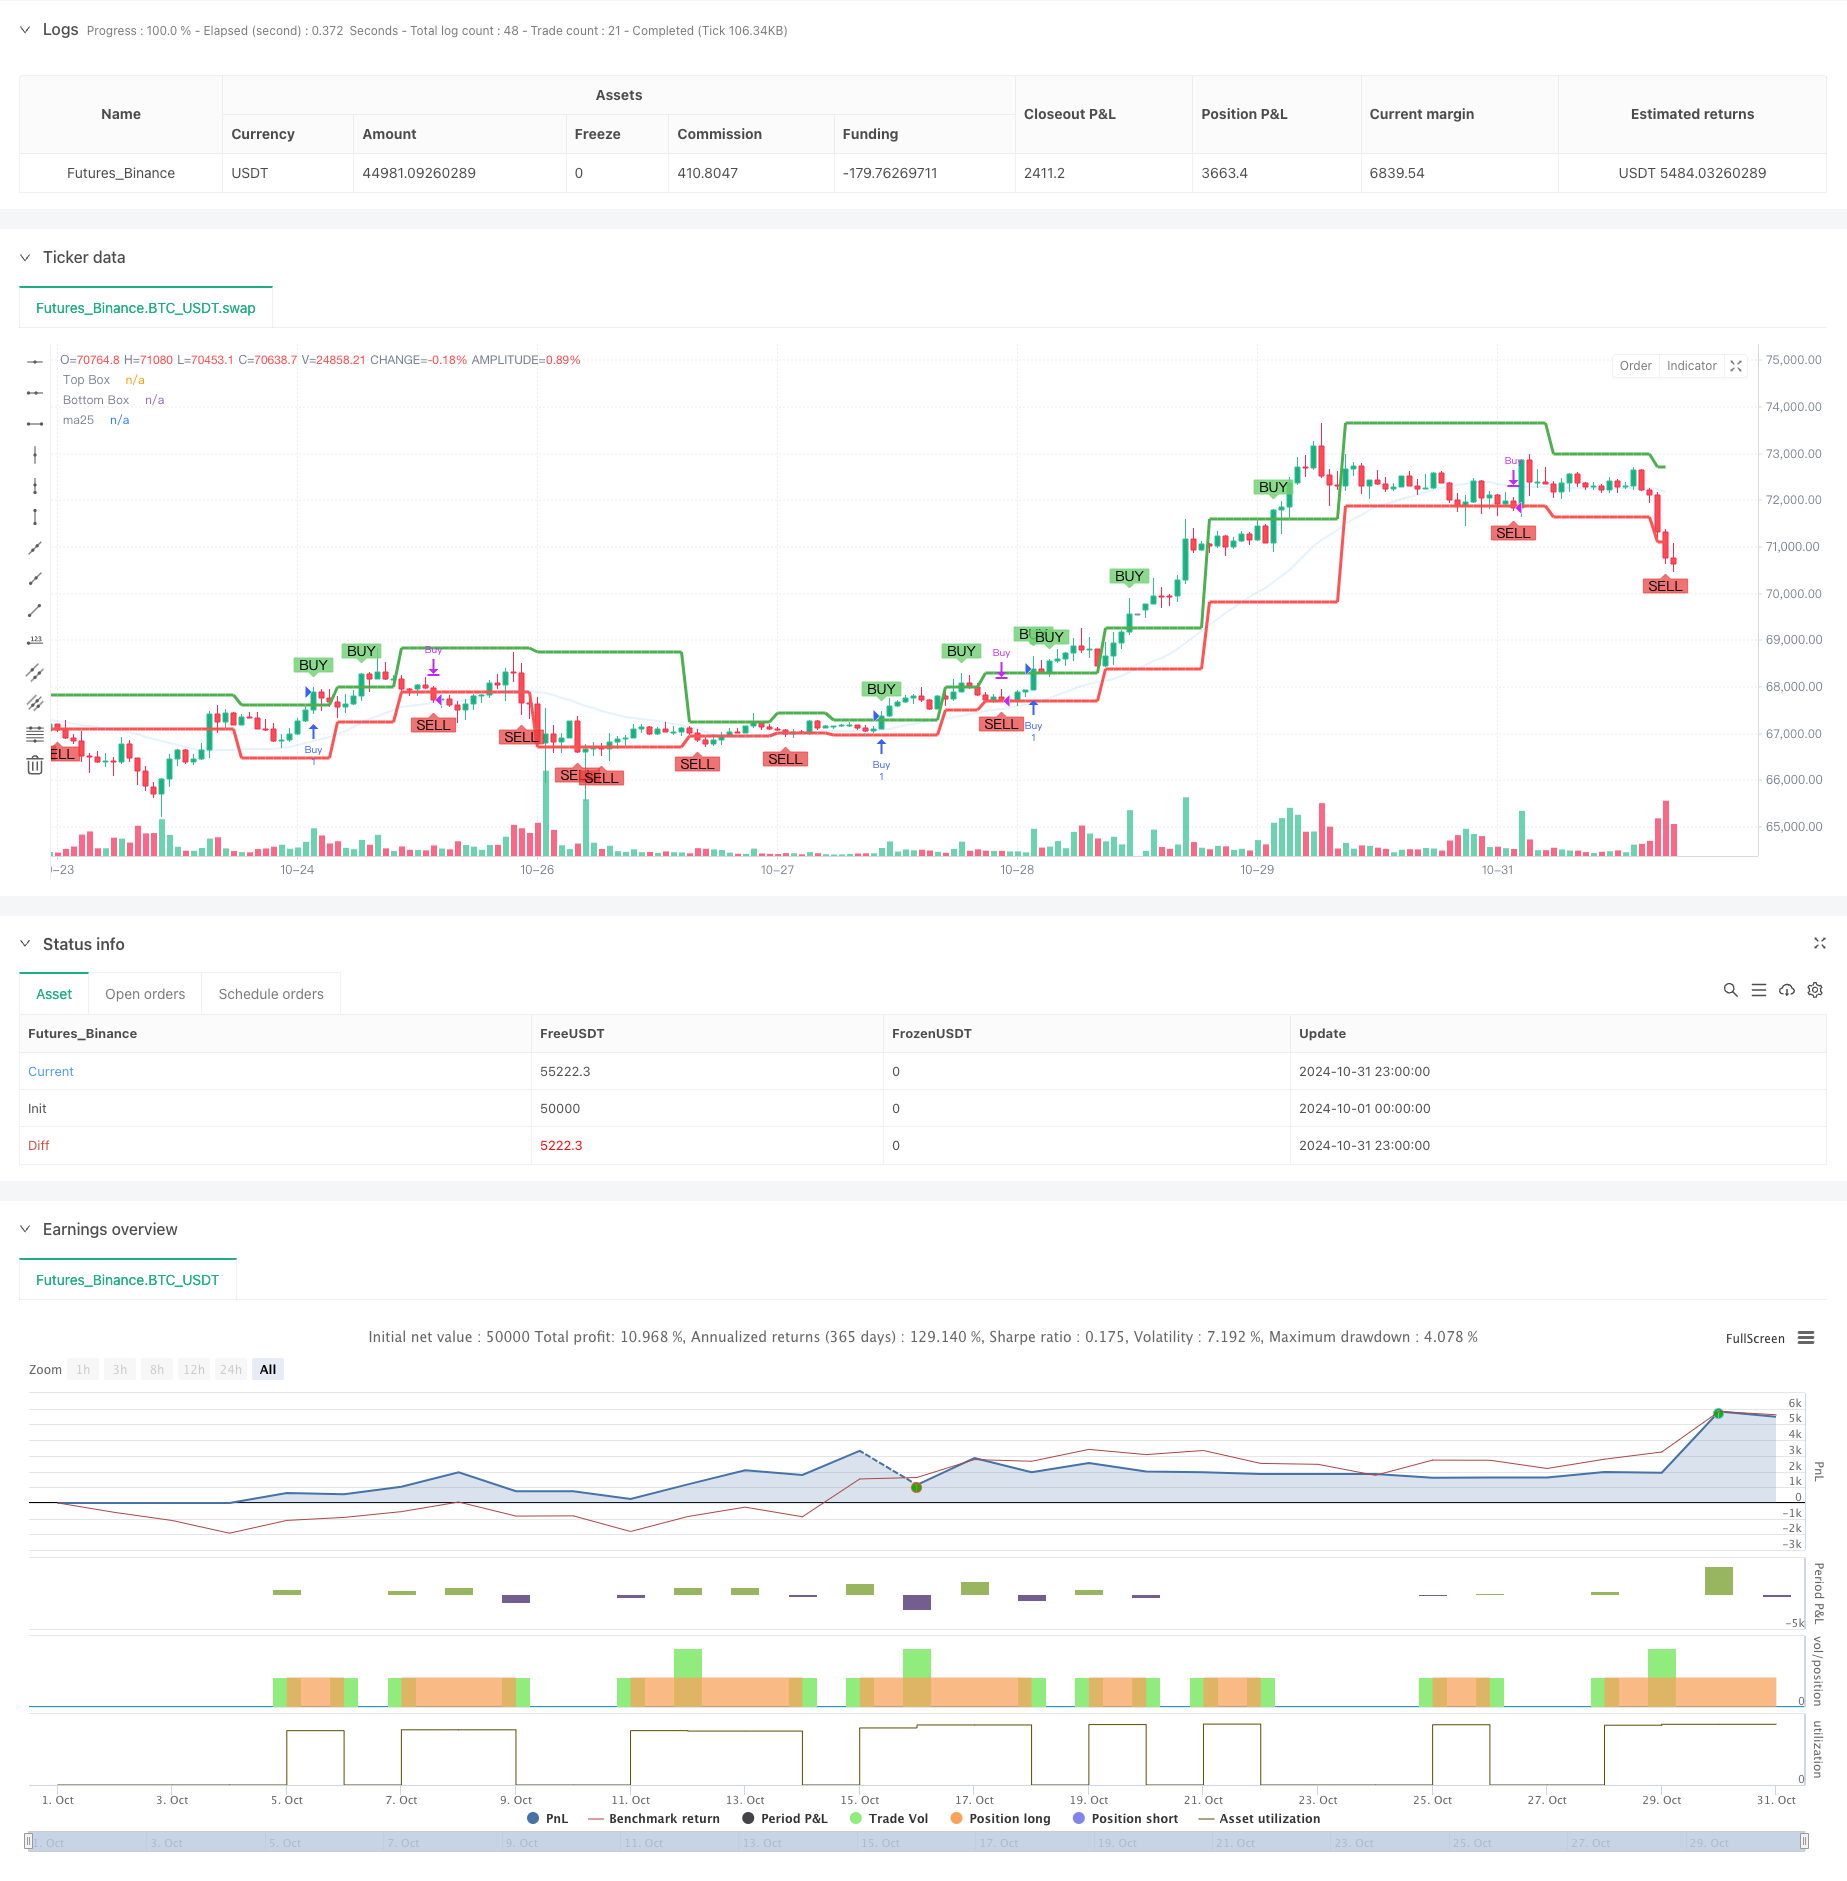
/*backtest
start: 2024-10-01 00:00:00
end: 2024-10-31 23:59:59
period: 1h
basePeriod: 1h
exchanges: [{"eid":"Futures_Binance","currency":"BTC_USDT"}]
*/

//@version=5
strategy("DARVAS BOX with MA25 Buy Condition", overlay=true, shorttitle="AEG DARVAS")

// Input for box length
boxp = input.int(5, "BOX LENGTH")

// Calculate 25-period moving average
ma25 = ta.sma(close, 25)

// Lowest low and highest high within the box period
LL = ta.lowest(low, boxp)
k1 = ta.highest(high, boxp)
k2 = ta.highest(high, boxp - 1)
k3 = ta.highest(high, boxp - 2)

// New high detection
NH = ta.valuewhen(high > k1[1], high, 0)

// Logic to detect top and bottom of Darvas Box
box1 = k3 < k2
TopBox = ta.valuewhen(ta.barssince(high > k1[1]) == boxp - 2 and box1, NH, 0)
BottomBox = ta.valuewhen(ta.barssince(high > k1[1]) == boxp - 2 and box1, LL, 0)

// Plot the top and bottom Darvas Box lines
plot(TopBox, linewidth=3, color=color.green, title="Top Box")
plot(BottomBox, linewidth=3, color=color.red, title="Bottom Box")
plot(ma25, color=#2195f31e, linewidth=2, title="ma25")

// --- Buy and Sell conditions ---

// Buy when price breaks above the Darvas Box AND MA15
buyCondition = ta.crossover(close, TopBox) and close > ma25

// Sell when price drops below the Darvas Box
sellCondition = ta.crossunder(close, BottomBox)

// --- Buy and Sell Signals ---

// Plot BUY+ and SELL labels
plotshape(series=buyCondition, title="Buy+ Signal", location=location.abovebar, color=#72d174d3, style=shape.labeldown, text="BUY")
plotshape(series=sellCondition, title="Sell Signal", location=location.belowbar, color=color.rgb(234, 62, 62, 28), style=shape.labelup, text="SELL")

// --- Strategy execution ---

if (buyCondition)
    strategy.entry("Buy", strategy.long)

if (sellCondition)
    strategy.close("Buy")