
Visão geral
Trata-se de uma estratégia de negociação quantitativa baseada nos três indicadores técnicos VWAP, MACD e RSI. A estratégia identifica as oportunidades de compra e venda no mercado através da combinação de múltiplos sinais de transação média ponderada (VWAP), média móvel convergente e dispersa (MACD) e indicador de fraqueza relativa (RSI). A estratégia usa um mecanismo de parada percentual para gerenciar o risco e usa a estratégia de gerenciamento de posição para otimizar a utilização de fundos.
Princípio da estratégia
A lógica central da estratégia baseia-se na análise integrada de três indicadores principais:
- Usar o VWAP como a principal linha de referência de tendência, sendo considerado um potencial sinal de mudança de tendência quando o preço ultrapassa o VWAP
- O gráfico MACD é usado para confirmar a força e a direção da tendência, com valores positivos representando uma tendência ascendente e valores negativos representando uma tendência descendente
- O RSI é usado para identificar se o mercado está sobrecomprado ou sobrevendido, evitando entrar em situações extremas
As condições de compra devem ser preenchidas:
- Preços sobem mais do que o VWAP
- MACD em coluna positiva
- O RSI não atingiu o nível de sobrecompra
As condições de venda devem ser:
- Preço do VWAP despenca
- O MACD é negativo.
- RSI não alcançou o nível de oversold
Vantagens estratégicas
- Verificação cruzada de múltiplos indicadores técnicos para aumentar a confiabilidade do sinal
- Introdução de fatores de volume de transação através do VWAP para aumentar a análise de profundidade do mercado
- O RSI pode ser usado para filtrar a tendência extrema e reduzir o risco de false breakouts.
- Percentagem de stop loss, adaptando-se dinamicamente a diferentes intervalos de preços
- Position sizing baseado na proporção do patrimônio líquido da conta, que permite a gestão de posições dinâmicas
- A lógica da estratégia é clara, fácil de entender e manter.
Risco estratégico
- Mercado turbulento pode gerar transações frequentes e aumentar custos de transação
- Indicadores múltiplos podem causar atraso no sinal e afetar o tempo de entrada
- A paralisação por percentual fixo pode não ser adequada para todos os cenários de mercado
- Aumento do risco em períodos de alta volatilidade, sem levar em conta a variação da taxa de flutuação do mercado
- Falta de filtragem de intensidade de tendência, podendo gerar excesso de sinais em mercados de tendência fraca
Direção de otimização da estratégia
- Introdução do ATR para ajustar a amplitude de stop loss de forma dinâmica para melhor se adaptar às flutuações do mercado
- Adição de filtros de intensidade de tendência para reduzir os falsos sinais de um mercado em choque
- Optimizar a configuração do ciclo VWAP para considerar combinações VWAP de múltiplos períodos
- Introdução de um mecanismo de confirmação de entrega para aumentar a confiabilidade do sinal de ruptura
- Considere adicionar filtros de tempo para evitar transações em períodos de baixa liquidez
- Mecanismos de dimensionamento de posições com ajustes dinâmicos de acordo com as condições do mercado
Resumir
A estratégia utiliza três indicadores técnicos clássicos, VWAP, MACD e RSI, para construir um sistema de negociação relativamente completo. A estratégia é projetada com foco na confiabilidade do sinal e na gestão de risco, para melhorar a qualidade da negociação através da verificação cruzada de múltiplos indicadores. Embora existam alguns aspectos que precisam de otimização, a estrutura geral é razoável e tem uma boa escalabilidade.
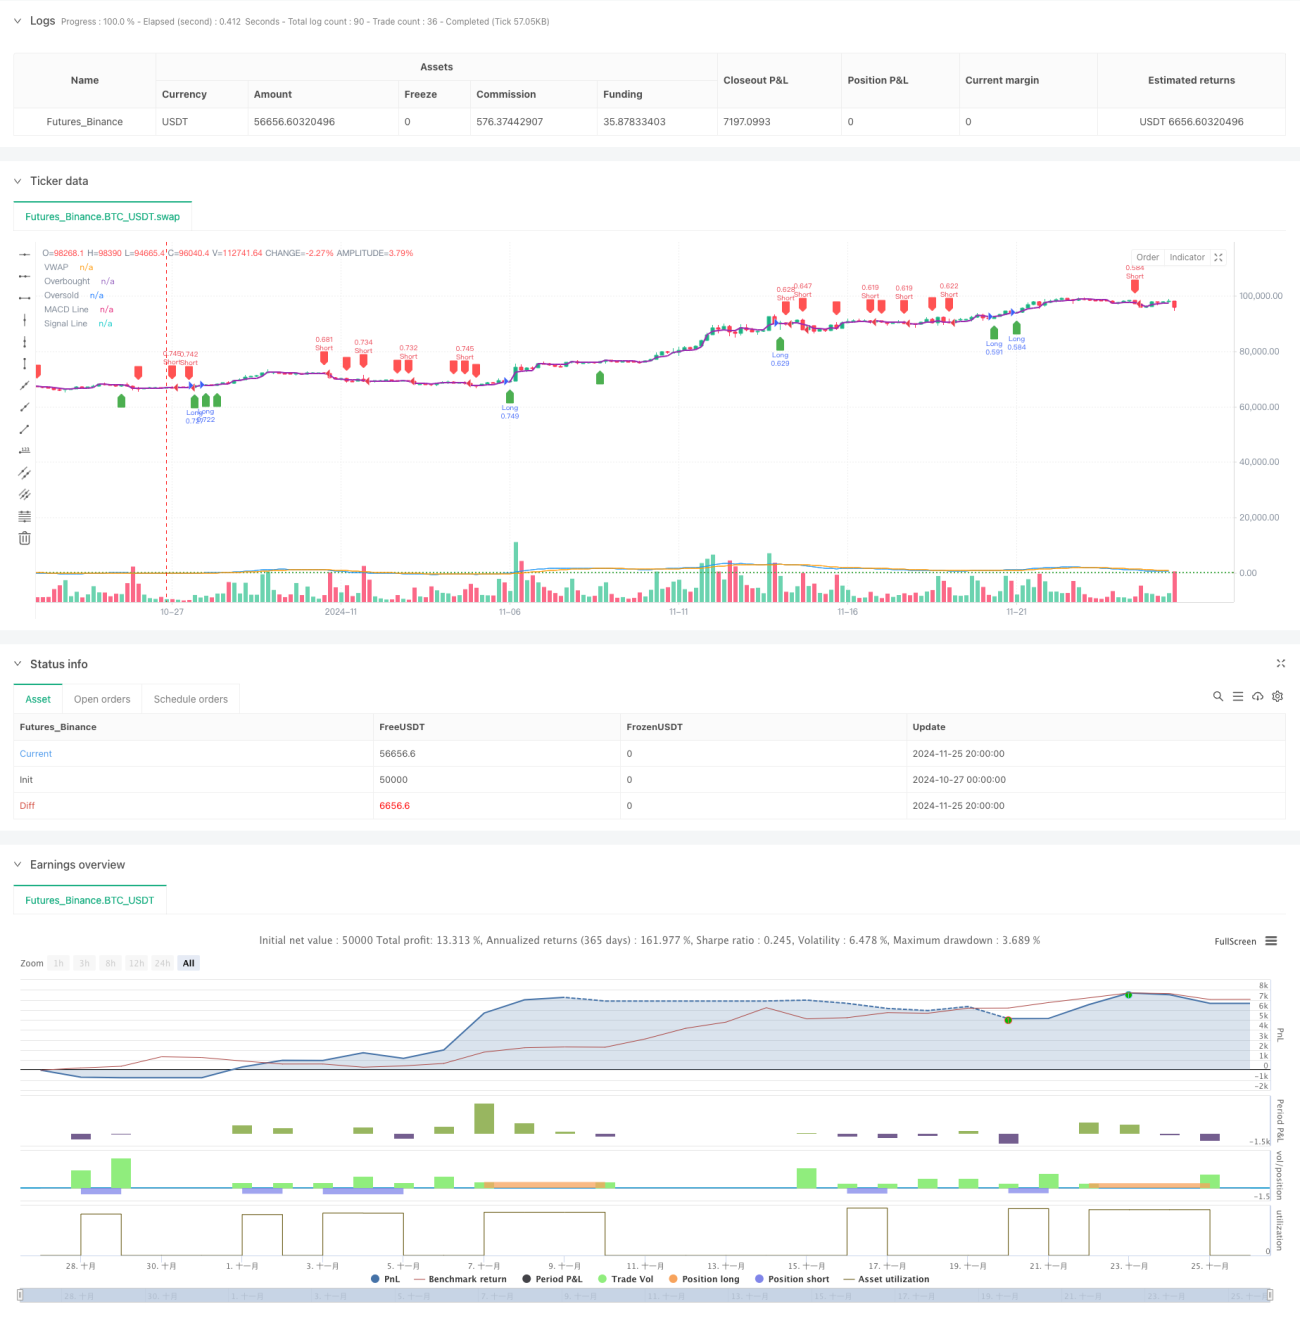
/*backtest
start: 2024-10-27 00:00:00
end: 2024-11-26 00:00:00
period: 4h
basePeriod: 4h
exchanges: [{"eid":"Futures_Binance","currency":"BTC_USDT"}]
*/

//@version=5
strategy("pbs", overlay=true, default_qty_type=strategy.percent_of_equity, default_qty_value=100)

// Input for take-profit and stop-loss- 1