Rastreamento de tendência de média móvel T3 e estratégia de negociação quantitativa de stop loss móvel

Visão geral
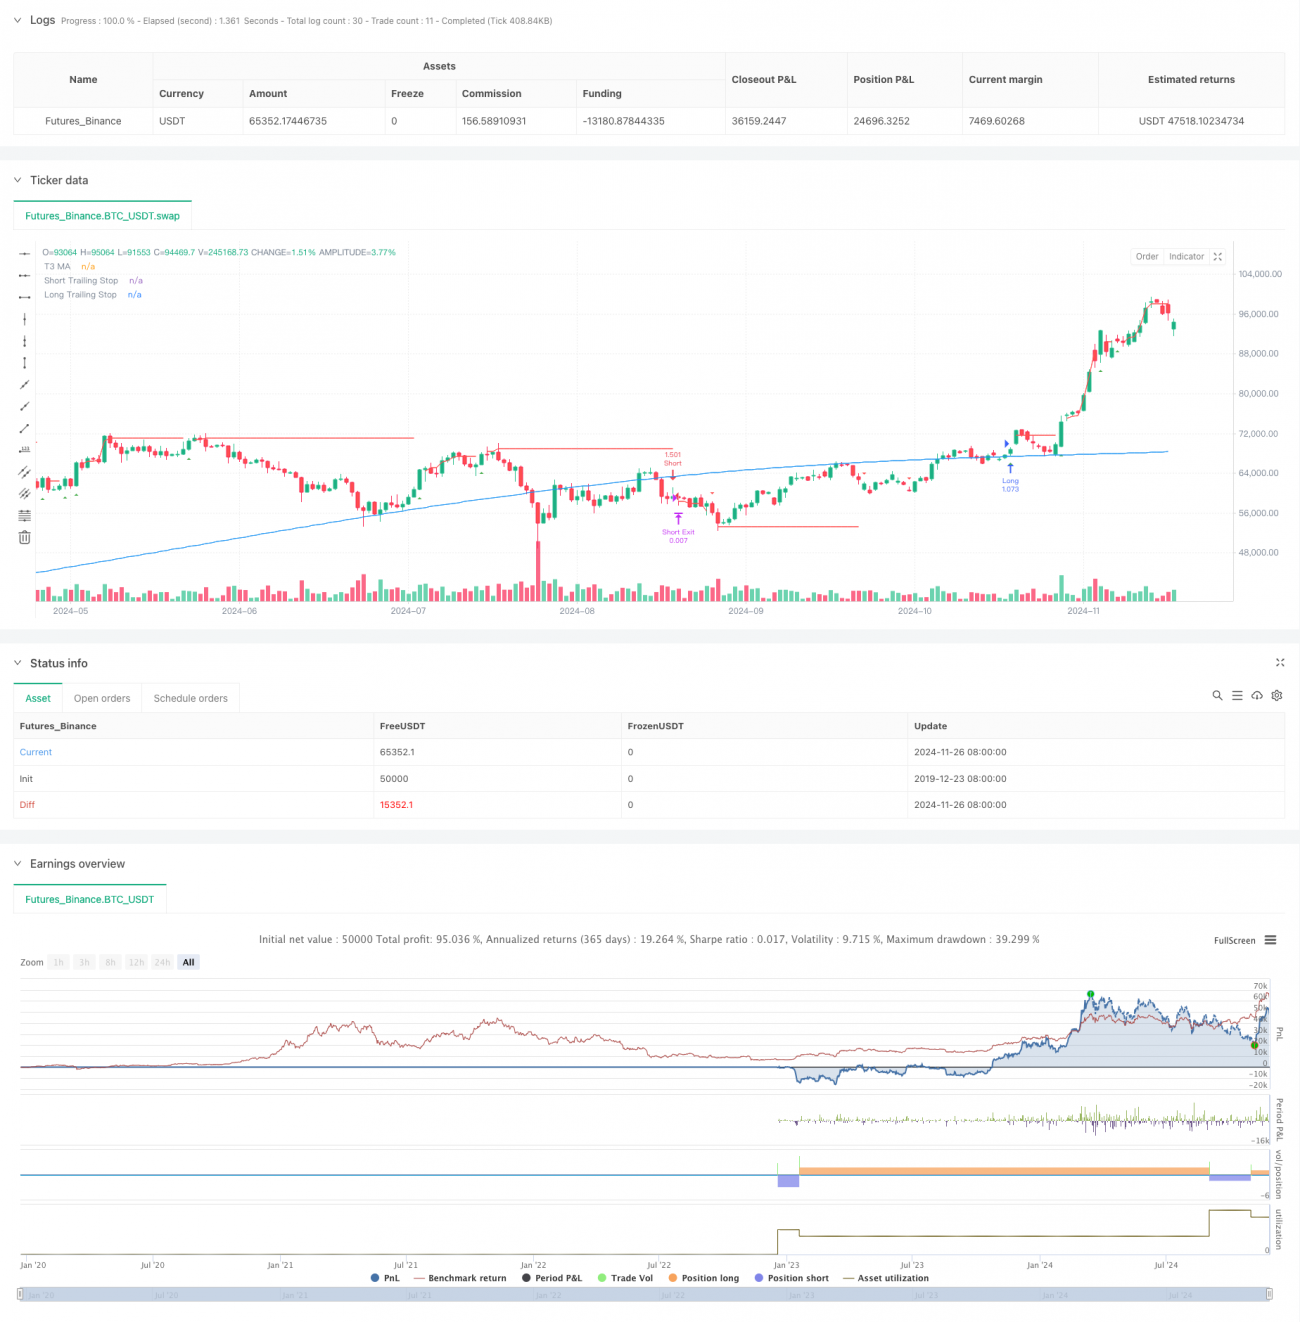
Esta estratégia é um sistema de negociação quantitativa integrado que combina a linha média T3, o acompanhamento de tendências e o mecanismo de parada móvel. A estratégia identifica a direção da tendência do mercado através da média móvel T3, ao mesmo tempo em que usa o indicador de tendência Lemon e o indicador TDFI para a confirmação de sinais, e funciona com o sistema de gerenciamento de risco combinado com a parada móvel e a parada fixa, para obter a captação da tendência e o controle efetivo do risco.
Princípio da estratégia
O núcleo da estratégia contém três partes principais: identificação de tendências, confirmação de sinais e gerenciamento de risco. Primeiro, o uso da média móvel T3 como principal ferramenta de identificação de tendências, a média T3 é calculada através de uma média móvel de índice hexagonal, que é capaz de reduzir efetivamente o atraso e manter a suavidade. Em seguida, o indicador de tendência Lemon calcula a faixa de flutuação dos preços, em combinação com o indicador TDFI, para filtrar os sinais de negociação, que só é produzido quando o preço quebra a faixa de flutuação e o indicador TDFI é confirmado.
Vantagens estratégicas
- Mecanismo de confirmação de múltiplos sinais melhora a precisão das transações
- O uso da linha média T3 diminui o efeito de falsas rupturas
- Um sistema de gestão de risco flexível, capaz de dar espaço suficiente para a tendência enquanto protege os lucros
- Apoio a paralisação parcial de posições, que permite a realização de lucros em etapas
- Parâmetros ajustáveis para otimização de acordo com diferentes cenários de mercado
Risco estratégico
- T3 mediano de linha de cálculo complexo, pode haver um atraso de cálculo
- A confirmação de múltiplos sinais pode levar a oportunidades de negociação perdidas
- A parada móvel pode ser desencadeada prematuramente em situações de forte volatilidade
- É preciso uma grande oscilação de preços para produzir um sinal eficaz.
- Falsos sinais podem ser frequentes no mercado horizontal
Direção de otimização da estratégia
- Introdução de um indicador de volatilidade para ajustar o parâmetro de stop loss móvel
- Adição de módulos de reconhecimento de cenários de mercado, usando diferentes parâmetros em diferentes condições de mercado
- Otimização do ciclo de cálculo dos indicadores TDFI, melhorando a atualização dos sinais
- Considere adicionar um fator de volume de transação para a confirmação de sinal
- Mecanismos de ajuste de proporção de suspensão parcial de auto-adaptação
Resumir
Trata-se de uma estratégia de acompanhamento de tendências abrangente, que garante a confiabilidade dos sinais de negociação, ao mesmo tempo em que permite um gerenciamento eficaz do risco, através da utilização conjunta de múltiplos indicadores técnicos. O design modular da estratégia permite uma boa escalabilidade e espaço de otimização, adequando-se como uma estrutura básica para sistemas de acompanhamento de tendências a médio e longo prazo.
/*backtest
start: 2019-12-23 08:00:00
end: 2024-11-27 00:00:00
period: 1d
basePeriod: 1d
exchanges: [{"eid":"Futures_Binance","currency":"BTC_USDT"}]
*/

//@version=5
strategy("Lemon Trend Strategy", overlay=true, initial_capital=10000, default_qty_type=strategy.percent_of_equity, default_qty_value=100)

// Input parameters- 1