
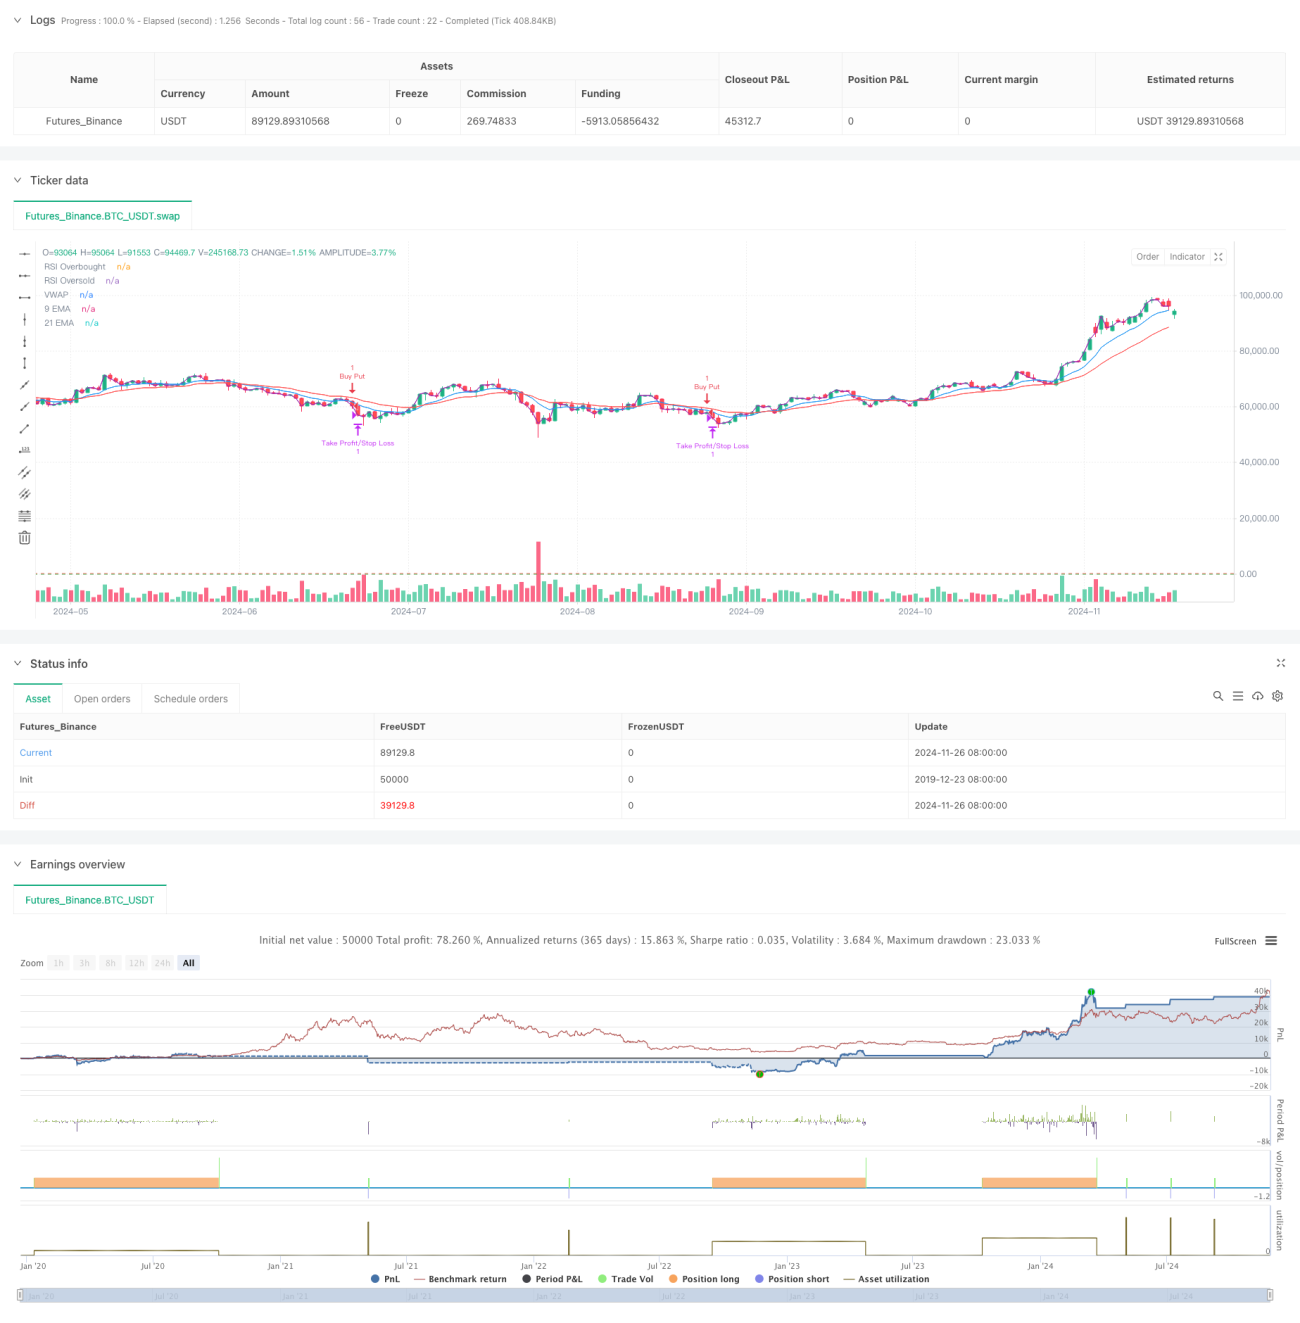
Visão geral
A estratégia é um sistema de negociação de alta frequência baseado em múltiplos indicadores técnicos, com um prazo de 5 minutos, combinado com um sistema linear, indicadores dinâmicos e análise de volume de transação. A estratégia adapta-se às flutuações do mercado de forma dinâmica, usando a confirmação de múltiplos sinais para aumentar a precisão e a confiabilidade das negociações. O núcleo da estratégia é capturar tendências de mercado de curto prazo por meio de uma combinação de indicadores técnicos multidimensionais, enquanto usa o stop loss dinâmico para controlar o risco.
Princípio da estratégia
A estratégia usa o sistema de dupla equilíbrio ((9 ciclo e 21 ciclo EMA) como principal ferramenta de determinação de tendências e confirma a dinâmica em combinação com o indicador RSI. Quando o preço está acima da dupla equilíbrio e o RSI está na faixa 40-65, o sistema procura oportunidades de negociação; Quando o preço está abaixo da dupla equilíbrio e o RSI está na faixa 35-60, o sistema procura oportunidades de negociação.
Vantagens estratégicas
- O mecanismo de confirmação de múltiplos sinais aumentou significativamente a confiabilidade das transações
- A configuração de stop loss dinâmica é capaz de se adaptar a diferentes condições de mercado
- Utilização de um limiar RSI mais conservador para evitar negociações em zonas extremas
- Mecanismo de confirmação de encomendas filtra sinais falsos
- O uso do VWAP ajuda a garantir que a direção das transações esteja de acordo com os fundos principais.
- Um sistema linear de resposta rápida é adequado para capturar oportunidades de mercado de curto prazo
Risco estratégico
- Falsos sinais frequentes podem ser gerados em mercados com oscilação horizontal
- A restrição de múltiplos termos pode levar a perda de algumas oportunidades de negociação
- As transações de alta frequência podem ter custos mais elevados
- Pode ser mais lento de reagir quando o mercado muda rapidamente.
- Requisitos mais elevados de tempo real para dados de mercado
Direção de otimização da estratégia
- Introdução de mecanismos de ajuste de parâmetros adaptáveis, permitindo que a estratégia ajuste os parâmetros do indicador de acordo com a dinâmica da situação do mercado
- Adição de módulos de identificação de cenários de mercado para diferentes estratégias de negociação em diferentes condições de mercado
- Para otimizar as condições de filtragem de volume de transação, pode-se considerar o uso de volume de transação relativo ou análise de volume de transação
- Melhorar o mecanismo de stop loss, podendo considerar a inclusão de função de stop loss de rastreamento
- Aumentar o filtro de tempo de negociação para evitar períodos de abertura e fechamento com maior volatilidade
Resumir
A estratégia utiliza uma combinação de múltiplos indicadores técnicos para construir um sistema de negociação relativamente completo. A vantagem da estratégia reside no seu mecanismo de confirmação de sinal multidimensional e no seu método de controle de risco dinâmico. Embora existam alguns riscos potenciais, a estratégia ainda tem um bom valor de aplicação com a otimização e o gerenciamento de riscos de parâmetros razoáveis.
- 1