Bandas de Bollinger e estratégia de negociação de combinação de força relativa

Visão geral
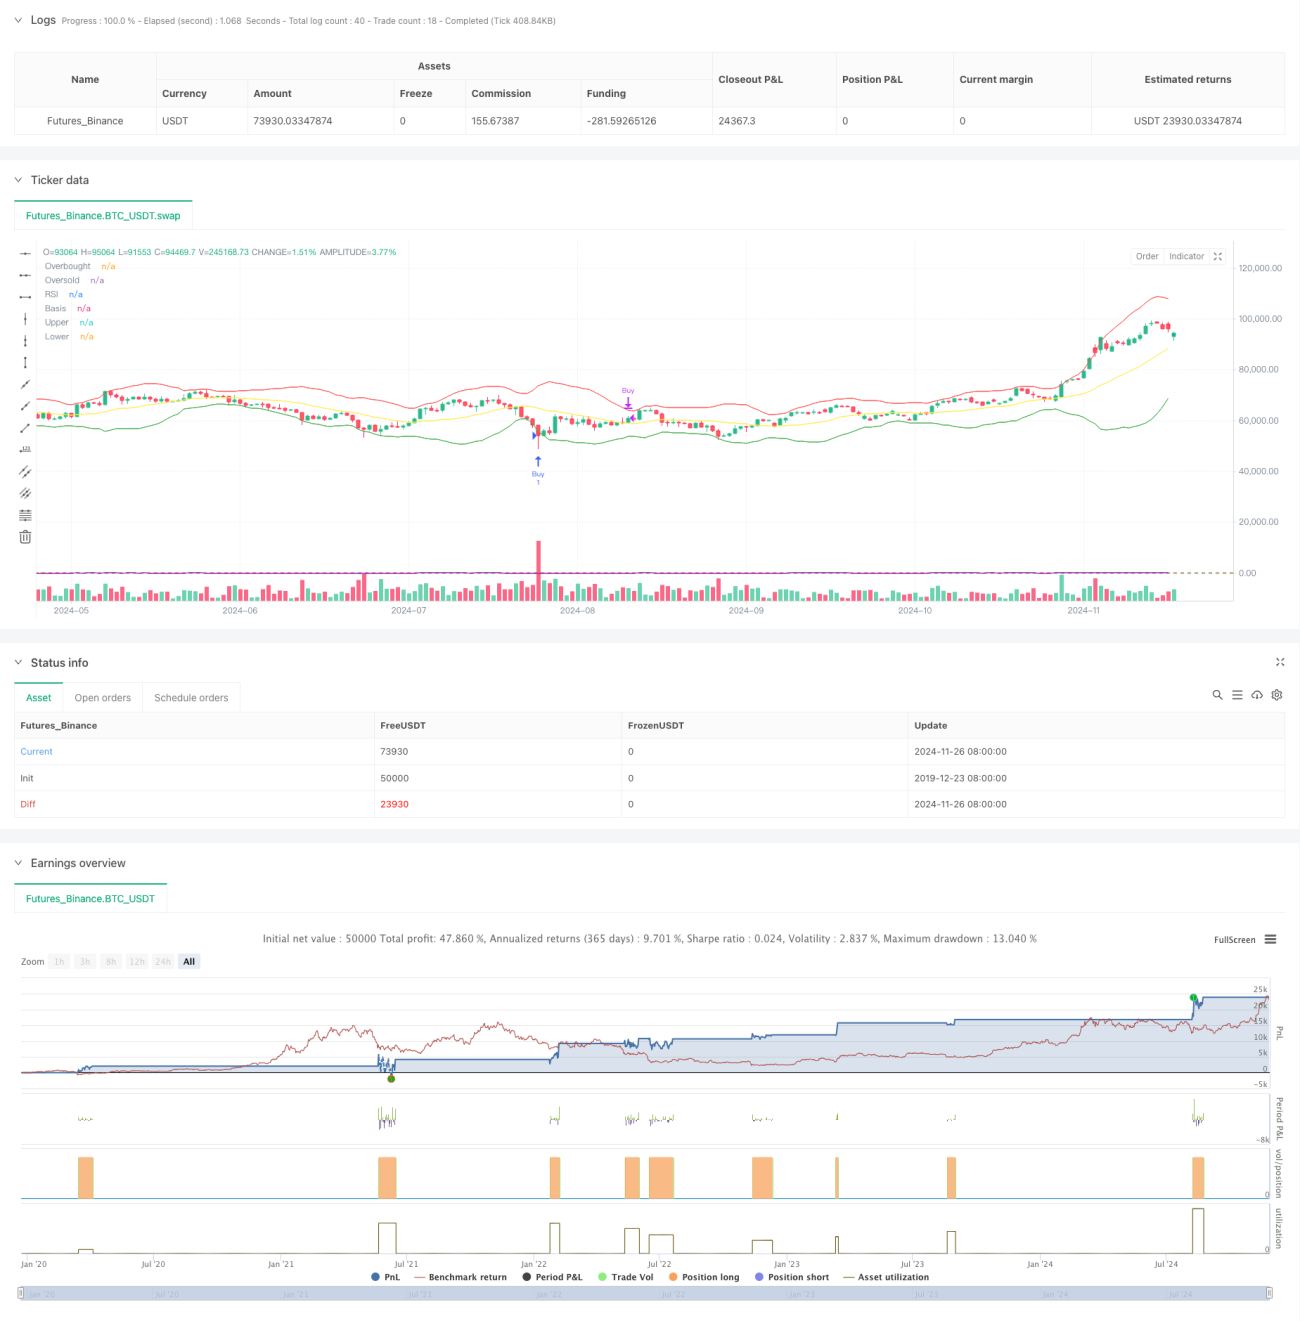
Esta estratégia combina os dois indicadores técnicos clássicos, as bandas de Bollinger e o indicador relativamente forte RSI, formando um sistema de negociação completo. A estratégia busca oportunidades de negociação principalmente capturando a volatilidade e a mudança de dinâmica do mercado, especialmente para o uso de comerciantes de dias.
Princípio da estratégia
A lógica central da estratégia consiste em combinar os indicadores de volatilidade de preços com os indicadores de momentum. A faixa de Bolin é composta por uma média móvel simples de 20 dias como um meio-trajeto, e o trajeto ascendente e descendente é um meio-trajeto com a redução de 2,5 vezes a diferença padrão. Quando o preço toca o trajeto descendente e o RSI está abaixo de 30, o sistema emite um sinal de multiplicação; quando o preço entra no trajeto ascendente e o RSI está acima de 70, o sistema emite um sinal de equilíbrio.
Vantagens estratégicas
- Alta confiabilidade do sinal: a confiabilidade do sinal de negociação foi aumentada significativamente através da combinação de dois indicadores técnicos de diferentes dimensões
- Controle de risco perfeito: condições de entrada e saída claras reduzem o impacto das transações emocionais
- Adaptabilidade: os parâmetros da estratégia podem ser ajustados de forma flexível para diferentes situações de mercado
- Lógicas de operação claras: regras de negociação claras, fáceis de executar e de rastrear
- Risco-benefício razoável: um bom risco-benefício é assegurado por meio de um bom stop-loss
Risco estratégico
- Risco de choque de mercado: pode produzir falsos sinais em um ambiente de mercado altamente volátil
- Risco de mercado em tendência: pode perder parte do mercado em forte tendência
- Sensibilidade de parâmetros: os efeitos da estratégia são sensíveis às configurações de parâmetros e precisam de otimização contínua
- Efeito de deslizamento: pode haver um deslizamento maior em mercados com menos liquidez
- Risco sistêmico: surpresas de mercado podem levar a falhas de estratégia
Direção de otimização da estratégia
- Otimização de parâmetros dinâmicos: os parâmetros de Bollinger Bands podem ser considerados para serem ajustados dinamicamente de acordo com a volatilidade do mercado
- Aumentar o filtro de tendência: introduzir indicadores de julgamento de tendência para evitar sinais errados em mercados de forte tendência
- Melhorar o mecanismo de amortização: criar estratégias de amortização mais flexíveis e aumentar a eficiência do uso de fundos
- Confirmação de sinal optimizada: aumento de indicadores auxiliares como volume de tráfego para melhorar a confiabilidade do sinal
- Melhor estratégia de liquidação: conceber objetivos de lucro e condições de parada mais detalhadas
Resumir
A estratégia, através de uma combinação inteligente de indicadores de Bollinger Bands e RSI, constrói um sistema de negociação rigoroso e operacional. Os principais benefícios da estratégia são a alta confiabilidade do sinal, o controle de risco perfeito e a forte adaptabilidade. Embora possa enfrentar alguns desafios em certos cenários de mercado, o desempenho geral da estratégia ainda tem um bom valor de aplicação através de otimização e melhoria contínuas.
Overview
This strategy combines Bollinger Bands and Relative Strength Index (RSI) to form a comprehensive trading system. It primarily seeks trading opportunities by capturing market volatility and momentum changes, particularly suitable for intraday traders. The strategy uses Bollinger Bands to measure market volatility while incorporating RSI to confirm overbought and oversold conditions, generating more reliable trading signals.
Strategy Principles
The core logic combines volatility and momentum indicators. Bollinger Bands consist of a 20-day simple moving average as the middle band, with upper and lower bands set at 2.5 standard deviations. Buy signals are generated when price touches the lower band and RSI is below 30, while exit signals occur when price breaks above the upper band and RSI exceeds 70. Additionally, the strategy includes an extra exit condition when RSI rises above 50, helping to secure profits. The design thoroughly considers market volatility characteristics and price momentum patterns.
Strategy Advantages
- High Signal Reliability: Combining two different technical indicators significantly improves trading signal reliability
- Comprehensive Risk Control: Clear entry and exit conditions effectively reduce emotional trading
- Strong Adaptability: Strategy parameters can be flexibly adjusted for different market conditions
- Clear Operational Logic: Trading rules are explicit, easy to execute and backtest
- Reasonable Risk-Reward Ratio: Appropriate profit-taking and stop-loss conditions ensure a favorable risk-reward ratio
Strategy Risks
- Choppy Market Risk: May generate false signals in highly volatile market conditions
- Trend Market Risk: Might miss some opportunities in strong trending markets
- Parameter Sensitivity: Strategy performance is sensitive to parameter settings, requiring continuous optimization
- Slippage Impact: May face significant slippage in markets with poor liquidity
- Systematic Risk: Market emergencies may cause strategy failure
Strategy Optimization Directions
- Dynamic Parameter Optimization: Consider dynamically adjusting Bollinger Bands parameters based on market volatility
- Add Trend Filters: Introduce trend identification indicators to avoid false signals in strong trending markets
- Improve Stop Loss Mechanism: Design more flexible stop-loss strategies to enhance capital efficiency
- Optimize Signal Confirmation: Add volume and other auxiliary indicators to improve signal reliability
- Enhance Exit Strategy: Design more detailed profit targets and stop-loss conditions
Summary
The strategy cleverly combines Bollinger Bands and RSI indicators to build a logically rigorous and highly operable trading system. Its main advantages lie in high signal reliability and comprehensive risk control, while maintaining strong adaptability. Although it may face challenges in certain market environments, the strategy maintains good practical value through continuous optimization and improvement. Traders should pay attention to changing market conditions, flexibly adjust strategy parameters, and always maintain proper risk control in practical applications.
- 1