
Visão geral
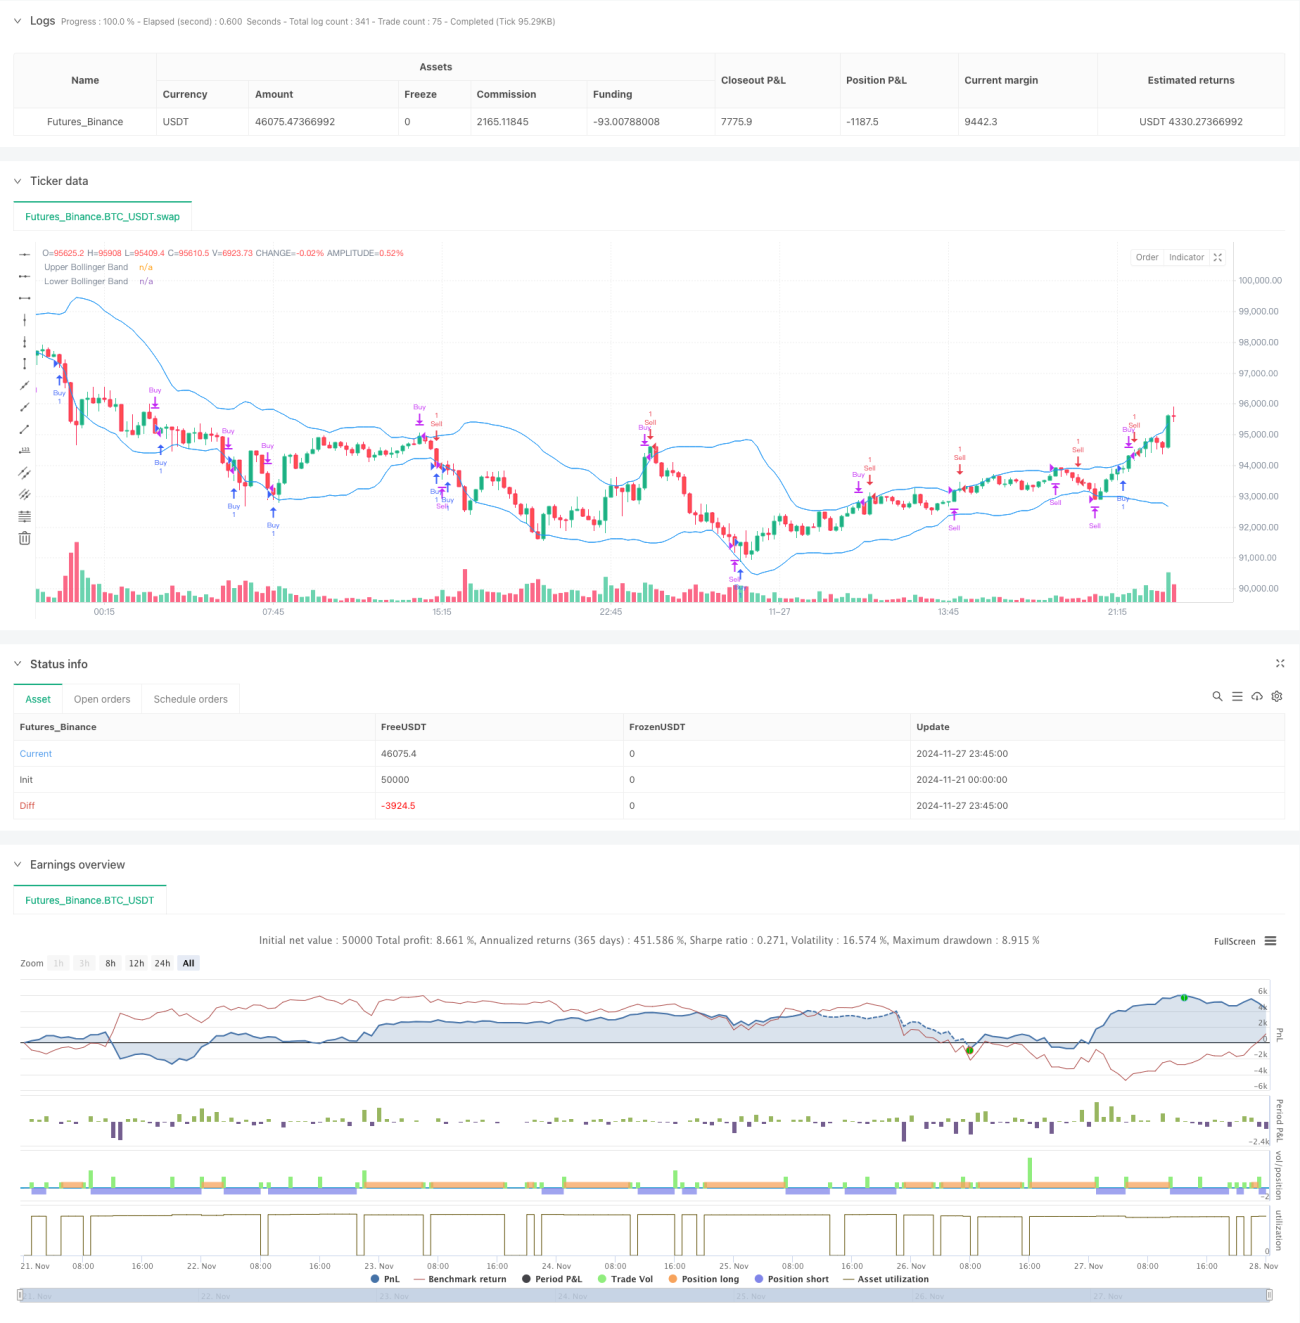
A estratégia é um sistema de negociação integrado baseado em múltiplos indicadores técnicos, que permite a captura de tendências de mercado e oportunidades de reversão por meio da combinação de indicadores técnicos como MACD, RSI, Bollinger Bands e ATR. A estratégia usa um plano de stop loss e profit dinâmico, capaz de ajustar os parâmetros de negociação de acordo com a volatilidade do mercado, controlando efetivamente o risco enquanto garante o lucro.
Princípio da estratégia
A estratégia utiliza um sistema de verificação de indicadores técnicos em vários níveis, incluindo:
- MACD ((12,26,9) é usado para capturar um sinal de conversão de momentum, gerando um sinal de compra quando o MACD passa pela linha de sinal e um sinal de venda quando passa pela linha
- RSI ((14) como um filtro secundário, abaixo de 35 é considerado uma zona de sobrevenda, acima de 65 é considerado uma zona de sobrecompra
- A faixa de Brin ((20, 2) é usada para identificar oscilações de preços, considerando a compra quando o preço toca a faixa baixa e a venda quando toca a faixa alta
- O ATR é usado para definir de forma dinâmica os níveis de stop loss e profit, com o stop loss definido em 3x o ATR e o profit definido em 5x o ATR
A lógica de negociação combina as estratégias de acompanhamento de tendências e negociação inversa, aumentando a precisão das negociações por meio de verificação múltipla. O sistema ajusta automaticamente os níveis de stop loss e profit de acordo com a volatilidade do mercado em tempo real, otimizando dinamicamente o gerenciamento de risco.
Vantagens estratégicas
- Sistemas de verificação de sinais multidimensionais aumentam a confiabilidade das transações
- Esquemas de stop loss e profit dinâmicos adaptados a diferentes cenários de mercado
- A combinação de tendências e inversões aumenta as oportunidades de negociação
- Sistemas automatizados de gestão de risco reduzem erros de julgamento humanos
- Uma taxa de vitória de 53,99% e um fator de lucro de 1,44 mostram que a estratégia é estável
- Estratégias de suporte a alertas de negociação em tempo real para facilitar a operação dos traders
Risco estratégico
- Indicadores múltiplos podem levar a sinais de atraso e perder oportunidades em mercados rápidos
- A taxa máxima de retirada de 56.33% requer maior tolerância ao risco
- A frequência das transações pode levar a custos mais elevados
- Estratégias que podem ser mais arriscadas em mercados de alta volatilidade
Sugestões de controle de risco:
- Implementar rigorosamente o plano de gestão de fundos
- Verificar e ajustar os parâmetros periodicamente
- Suspensão de transações durante a divulgação de dados importantes
- Configure o limite máximo de perda por dia
Direção de otimização da estratégia
-
Parâmetros de otimização:
- Parâmetros indicadores para considerar o uso de ciclos de adaptação
- Optimizar a configuração do ATR para aumentar a relação risco/benefício
-
Melhorias no sistema de sinalização:
- Adição de verificação de indicadores de transação
- Introdução de indicadores de sentimento de mercado
-
Otimização da Gestão de Riscos:
- Realize o gerenciamento dinâmico de posições
- Aumentar o filtro de tempo
-
Melhorias técnicas:
- Adição de filtros de taxa de flutuação
- Otimização do julgamento de tempo de entrada e saída
Resumir
A estratégia atinge um bom desempenho de negociação através da combinação de indicadores técnicos múltiplos e de um sistema de gestão de risco dinâmico. Apesar de existir um certo risco de retração, a estratégia demonstra boa adaptabilidade e estabilidade de mercado através de um rigoroso controle de risco e otimização contínua. É recomendado que os comerciantes apliquem rigorosamente o sistema de gestão de risco ao usar a estratégia e ajustar os parâmetros de acordo com as mudanças do mercado.
- 1