Estratégia de acompanhamento de tendência média de suavização dupla - com base na linha K aprimorada de Ping An Jiang

Visão geral
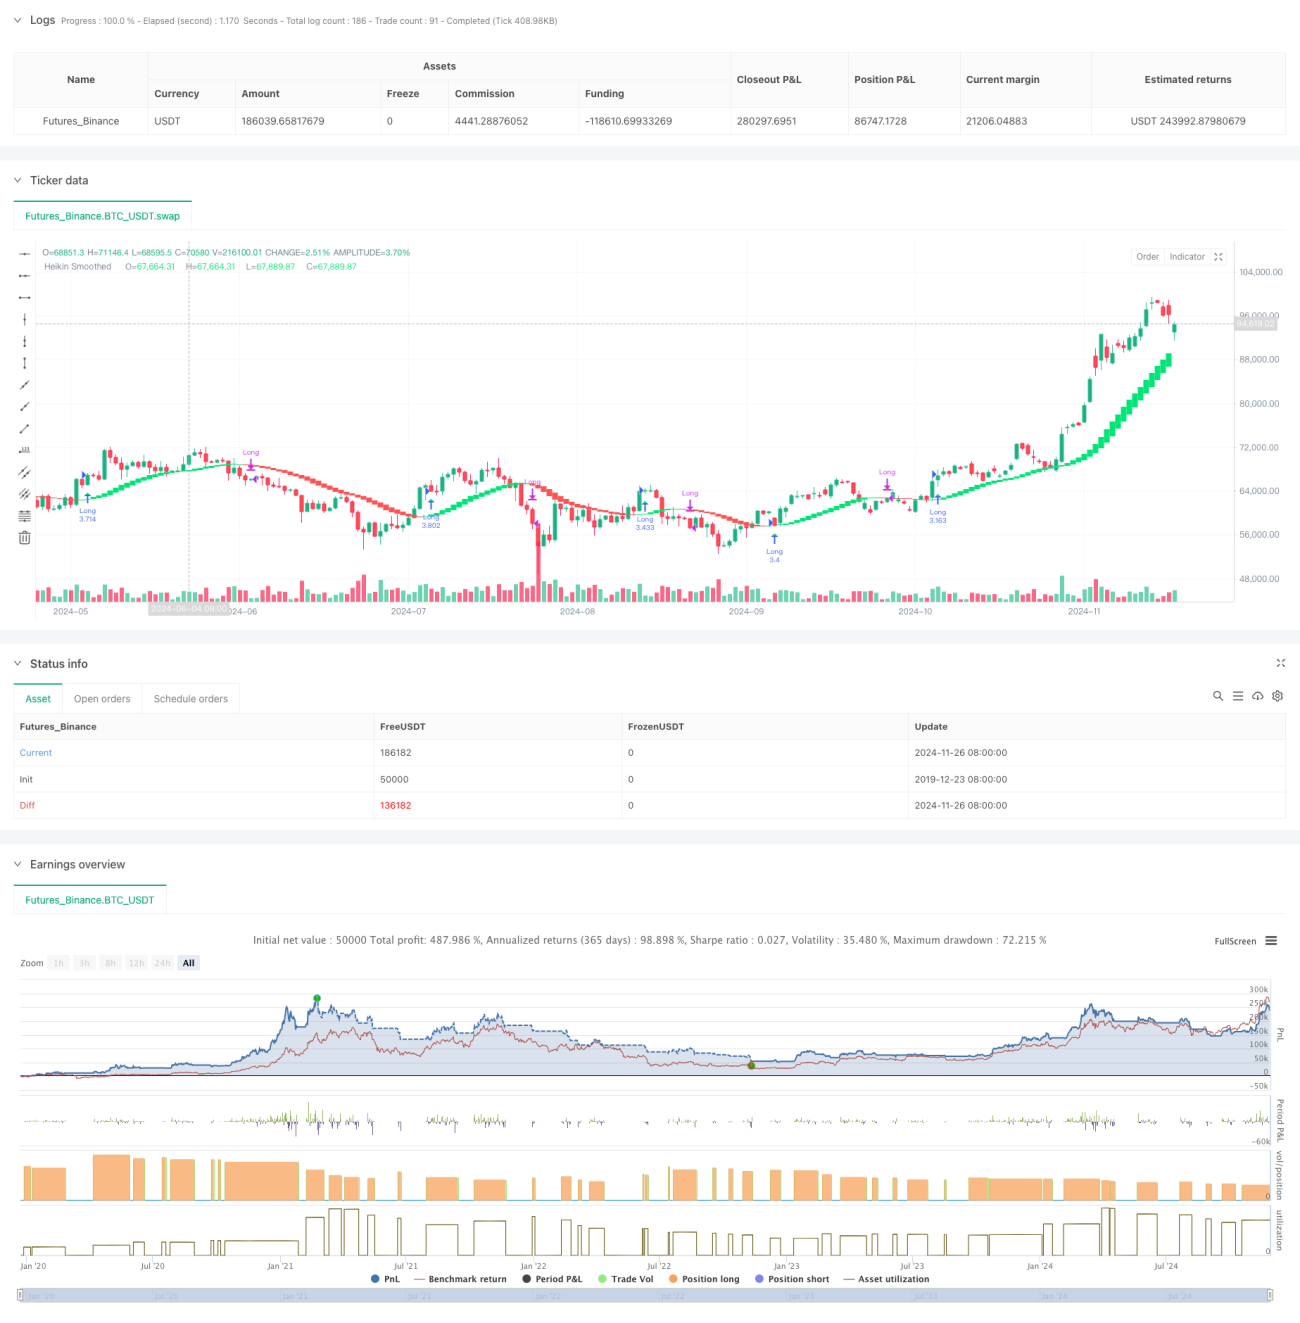
Esta estratégia é um sistema de acompanhamento de tendências baseado no Heikin-Ashi. A estratégia opera de várias maneiras, mantendo posições em tendências ascendentes e posições em tendências descendentes, captando tendências com eficiência para obter ganhos de mercado.
Princípio da estratégia
A lógica central da estratégia inclui as seguintes etapas principais:
- Primeira suavização EMA de dados de preços de OHLC
- Linha K de Pingyang, modelo melhorado para calcular preços após suavização
- Segundo EMA de suavização da linha K de Pyongyang
- A variação da cor da linha K é julgada pela comparação entre o preço de abertura e o preço de fechamento após o alinhamento
- A linha K gera um sinal de compra quando o vermelho se torna verde e um sinal de venda quando o verde se torna vermelho
- Transações com posições de 100% do valor total da conta
Vantagens estratégicas
- O processamento de dupla suavização reduz significativamente os falsos sinais
- A estratégia reduz o risco de falência
- A partir da confirmação da tendência, a probabilidade de vitória aumenta.
- Sistema de sinalização completo para transações automatizadas
- Opções de períodos de tempo flexíveis para atender a diferentes necessidades de transação
- Regras de entrada e saída simples e claras para facilitar a execução
- Apoio à gestão de fundos em diferentes condições de mercado
Risco estratégico
- A reversão de tendência pode ter início com uma retracção maior.
- Falso sinal pode ser produzido em mercados em turbulência
- O método de negociação de posição total aumenta o risco de capital
- O atraso no sinal de entrada pode ter perdido parte da subida
- Diferenças de desempenho em diferentes períodos de tempo
Direção de otimização da estratégia
- Introdução de filtros de intensidade de tendência para reduzir os falsos sinais de mercado
- Aumentar a gestão dinâmica dos depósitos e otimizar a utilização dos fundos
- Adição de stop loss móvel para controlar o risco de retração
- Combinação com outros indicadores técnicos para confirmar a eficácia do sinal
- Desenvolver um sistema de parâmetros de adaptação para aumentar a estabilidade da estratégia
Resumir
A estratégia, com o duplo processamento de suavização e a linha K de Pyongyang em seu núcleo, constrói um robusto sistema de acompanhamento de tendências. A estratégia é concebida de forma concisa, fácil de entender e executar, além de oferecer várias direções de otimização para se adaptar a diferentes condições de mercado. Embora haja um certo risco de atraso e retirada, a estratégia pode fornecer aos investidores uma ferramenta de acompanhamento de tendências confiável por meio de medidas razoáveis de gerenciamento de fundos e controle de risco.
/*backtest
start: 2019-12-23 08:00:00
end: 2024-11-27 08:00:00
period: 1d
basePeriod: 1d
exchanges: [{"eid":"Futures_Binance","currency":"BTC_USDT"}]
*/

//@version=5
strategy("Smoothed Heiken Ashi Strategy Long Only", overlay=true, initial_capital=1000, default_qty_type=strategy.percent_of_equity, default_qty_value=100)

len = input.int(10, title="EMA Length")- 1