Sistema de negociação de média móvel de momentum híbrido de cadeia dupla

Visão geral
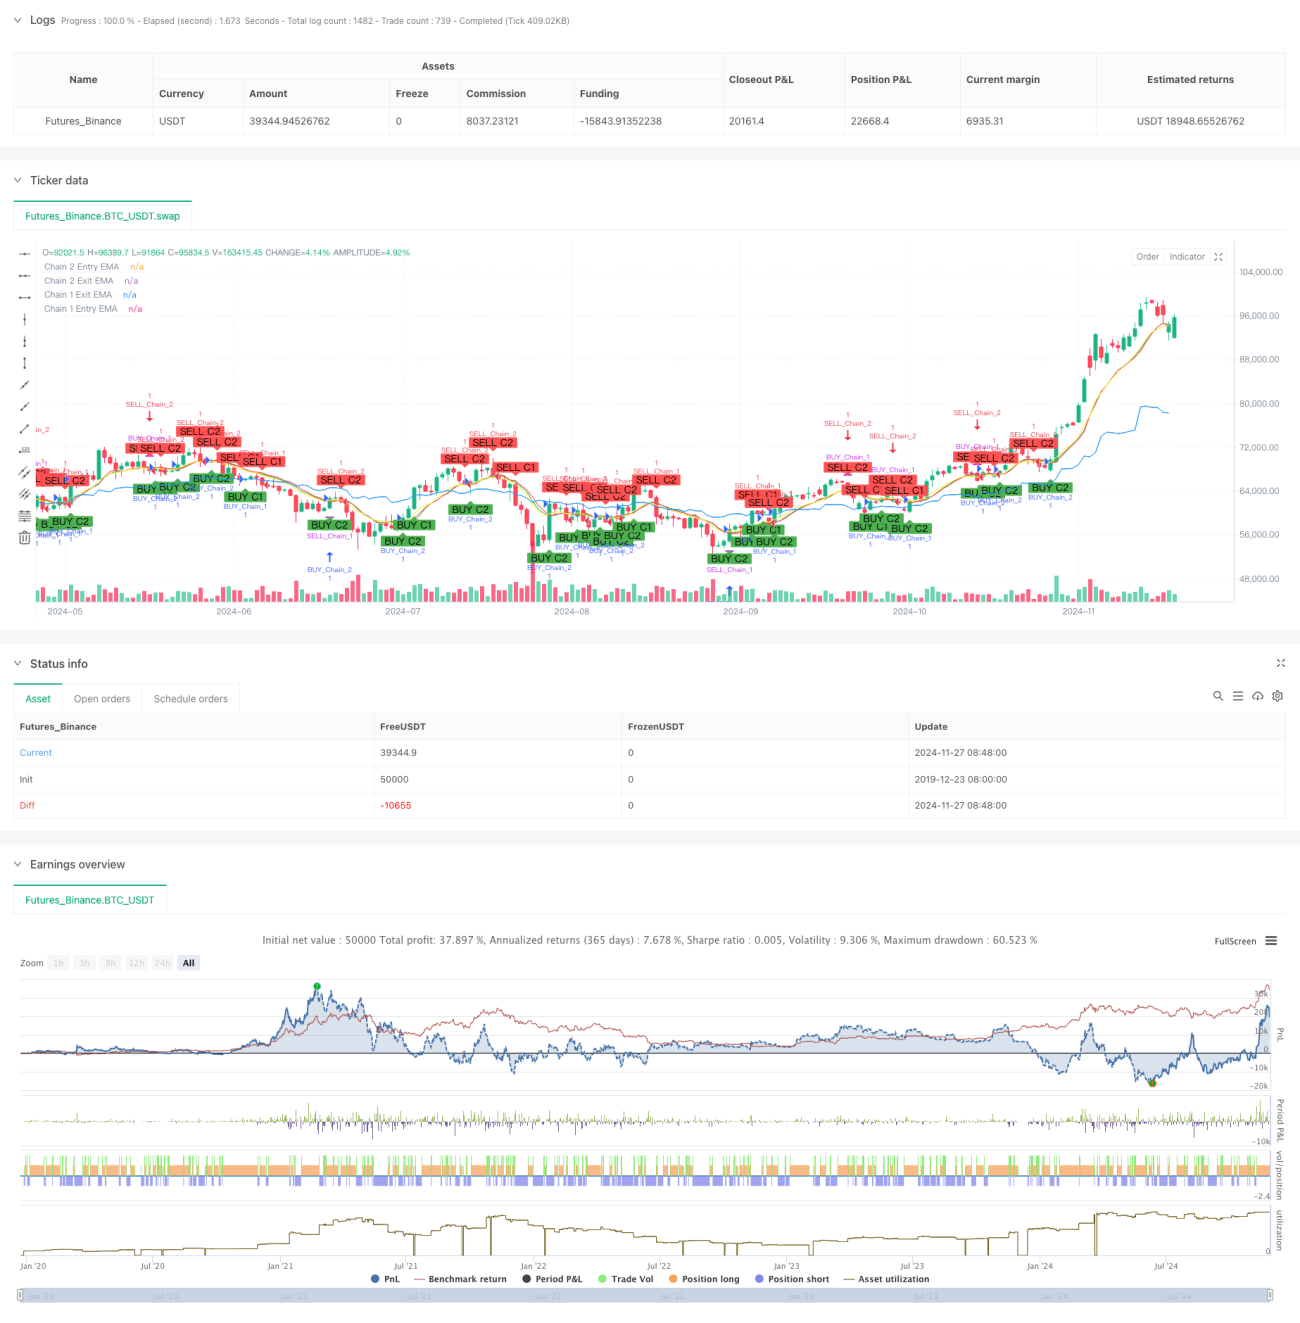
Esta estratégia é um sistema de negociação inovador baseado em EMAs, que captura oportunidades de mercado através da criação de duas cadeias de negociação independentes em diferentes períodos de tempo. A estratégia integra os benefícios do acompanhamento de tendências de longo prazo e do volume de negociação de curto prazo, gerando sinais de negociação através do cruzamento de EMAs em vários períodos de tempo, como semanal, diário, 12 horas e 9 horas.
Princípio da estratégia
A estratégia usa um design de cadeia dupla, cada uma com uma lógica de entrada e saída única:
Linha 1 (trend de longo prazo) utiliza o perímetro e o ciclo do dia:
- sinal de entrada: um sinal de multiplicação é gerado quando o preço de fechamento atravessa uma EMA no ciclo da linha de rotação
- Exit Signal: Um sinal de parada é gerado quando o preço de fechamento atravessa a EMA no ciclo da linha do sol
- O ciclo EMA padrão é de 10 e pode ser ajustado conforme necessário.
Linha 2 (movimento de curto prazo) utiliza ciclos de 12 horas e 9 horas:
- sinal de entrada: um sinal de multiplicação é gerado quando o preço de fechamento atravessa uma EMA em um ciclo de 12 horas
- Exit Signal: um sinal de parada quando o preço de fechamento atravessa uma EMA em um ciclo de 9 horas
- O ciclo EMA padrão é de 9 e pode ser ajustado conforme necessário.
Vantagens estratégicas
- Análise multidimensional do mercado: compreensão da evolução do mercado através da combinação de diferentes períodos de tempo
- Flexível: as duas cadeias podem ser ativadas ou desativadas independentemente, adaptando-se a diferentes estilos de negociação
- Controle de risco perfeito: Confirmação com múltiplos períodos de tempo, reduzindo o risco de falsos sinais
- Parâmetros são ajustáveis: o ciclo EMA e o ciclo de tempo podem ser modificados conforme necessário
- Perfeccionamento da função de retorno: configuração durante o retorno embutido para facilitar a verificação e otimização da estratégia
Risco estratégico
- Risco de reversão de tendência: a possibilidade de atraso em mercados altamente voláteis
- Risco de configuração de ciclo de tempo: diferentes mercados podem exigir diferentes combinações de ciclos de tempo
- Risco de otimização de parâmetros: otimização excessiva pode levar a uma sobre-ajuste
- Risco de sobreposição de sinais: dois cadeias acionadas simultaneamente podem aumentar o risco de posse
Sugestões de controle de risco:
- Estabeleça um limite razoável de perda
- Parâmetros ajustados às características do mercado
- Verificação de retorno completa antes do disco
- Controle a taxa de capital para cada transação
Direção de otimização da estratégia
- Otimização da filtragem de sinal:
- Adicionar mecanismo de confirmação de volume
- Introdução do sinal de filtragem do indicador de flutuação
- Confirmação de aumento da intensidade da tendência
- Otimização do controle de risco:
- Desenvolvimento de mecanismos de parada dinâmica
- Projeto de um sistema de gestão de posições
- Adição de controle de retirada
- Otimização do ciclo de tempo:
- Pesquisar combinações ótimas de períodos de tempo
- Desenvolvimento de mecanismos de ciclo de tempo adaptativo
- Adição de identificação de estado de mercado
Resumir
O sistema de negociação de rastreamento de linha de média de volume híbrido de cadeia dupla permite a análise e a compreensão multidimensionais do mercado por meio da combinação inovadora de estratégias de linha de média de curto e longo prazo. O design do sistema é flexível, pode ser ajustado de acordo com diferentes condições de mercado e estilo de comerciante, com uma forte praticidade. Com o controle razoável do risco e otimização contínua, a estratégia espera obter ganhos estáveis na negociação real.
- 1