Crossover de média móvel dupla combinado com estratégia de negociação de otimização de momentum RSI

Visão geral
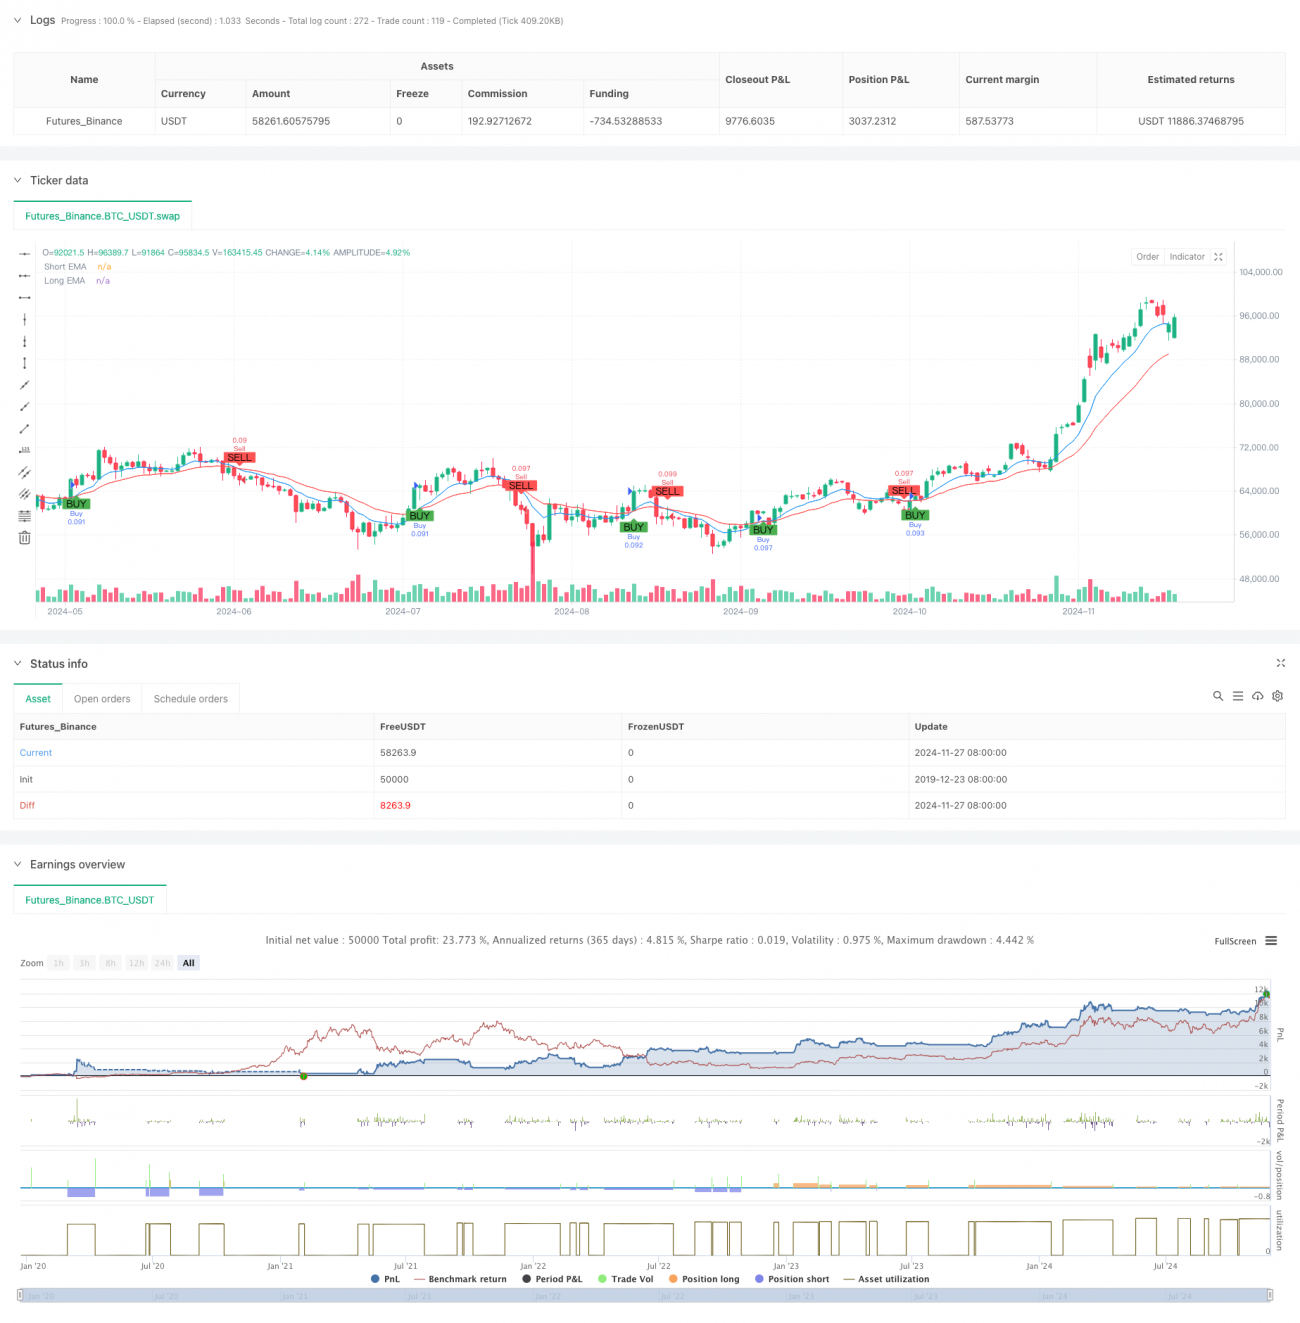
Esta estratégia é um sistema de negociação de curto prazo baseado na combinação de um cruzamento de dupla linha de equilíbrio e um indicador RSI. A estratégia usa um índice de média móvel de 9 ciclos e 21 ciclos (EMA) como base para determinar a tendência, enquanto combina um indicador relativamente forte (RSI) como uma ferramenta de confirmação de dinâmica para gerenciar o risco, definindo um stop loss e um stop loss fixos.
Princípio da estratégia
A lógica central da estratégia baseia-se na interação de dois indicadores técnicos. Primeiro, a direção da tendência do mercado é determinada pelo cruzamento de EMA de 9 ciclos e EMA de 21 ciclos. Quando a EMA curta atravessa a EMA de longo prazo para cima, é considerada uma tendência ascendente; Quando a EMA curta atravessa a EMA de longo prazo para baixo, é considerada uma tendência descendente.
Vantagens estratégicas
- Clareza de sinal: O mecanismo de filtragem dupla através do cruzamento equilátero e a confirmação RSI permite efetivamente reduzir o sinal falso.
- Risco controlado: A configuração de stop loss de porcentagem fixa permite que o risco esperado para cada transação seja claramente controlado.
- Alto grau de automação: estratégia lógica clara, parâmetros ajustáveis, facilitando a realização de transações automatizadas.
- Adaptabilidade: A estratégia pode se adaptar a diferentes ambientes de mercado, especialmente em mercados com tendências claras.
- Operação simples: condições de entrada e saída são claras, facilitando a execução e o acompanhamento dos comerciantes.
Risco estratégico
- Risco de mercado de choque: Pode haver frequentes falsos sinais em mercados de choque horizontal, resultando em perdas contínuas.
- Risco de deslizamento: pode haver um maior risco de deslizamento em operações de linha curta com um ciclo de 5 minutos.
- Risco de stop loss fixo: O uso de stop loss de porcentagem fixa pode não ser adequado para todos os cenários de mercado e pode ser demasiado intenso em mercados especialmente voláteis.
- Risco sistêmico: quando ocorrem eventos importantes no mercado, o stop loss fixo pode não proteger efetivamente os fundos.
Direção de otimização da estratégia
- Optimização de stop-loss dinâmico: pode ser considerado o ajuste dinâmico da distância de stop-loss de acordo com o indicador ATR, para que o stop-loss seja mais adequado às características de flutuação do mercado.
- Filtragem de tempo: Aumente a filtragem de períodos de negociação, evitando períodos de alta volatilidade ou falta de liquidez.
- Confirmação da força da tendência: pode ser adicionado um indicador ADX para confirmar a força da tendência, apenas quando a tendência é clara.
- Optimização da gestão de posições: o tamanho das posições pode ser ajustado de acordo com a volatilidade do mercado e a dinâmica do patrimônio líquido da conta.
- Identificação do cenário de mercado: Aumento do mecanismo de julgamento do cenário de mercado, com diferentes configurações de parâmetros em diferentes condições de mercado.
Resumir
A estratégia, combinando equilíbrio de linha cruzada e indicadores RSI, constrói um sistema de negociação de linha curta relativamente completo. Os benefícios da estratégia são a clareza do sinal, o risco é controlável, mas há também espaço para otimização. A estabilidade e a lucratividade da estratégia podem ser melhoradas adicionando mecanismos como stop loss dinâmico, filtragem de tempo e outros.
/*backtest
start: 2019-12-23 08:00:00
end: 2024-11-28 08:00:00
period: 1d
basePeriod: 1d
exchanges: [{"eid":"Futures_Binance","currency":"BTC_USDT"}]
*/

//@version=5
strategy("abo 3llash - EMA + RSI Strategy", overlay=true, default_qty_type=strategy.percent_of_equity, default_qty_value=10)

// Parameters- 1