Visão geral
A estratégia é um sistema de negociação integrado que combina um sistema de dupla linha de equilíbrio, uma análise de indicadores de força relativa (RSI) e de força relativa (RS). A estratégia realiza um mecanismo de decisão de negociação multidimensional, através da confirmação de tendências de confirmação cruzada de médias móveis do índice (EMA) nos dias 13 e 21 e da confirmação de sinais de negociação em combinação com o RSI e o valor do RS em relação ao índice de referência. A estratégia também inclui um mecanismo de controle de risco e um julgamento baseado em condições de reentrada de 52 semanas.
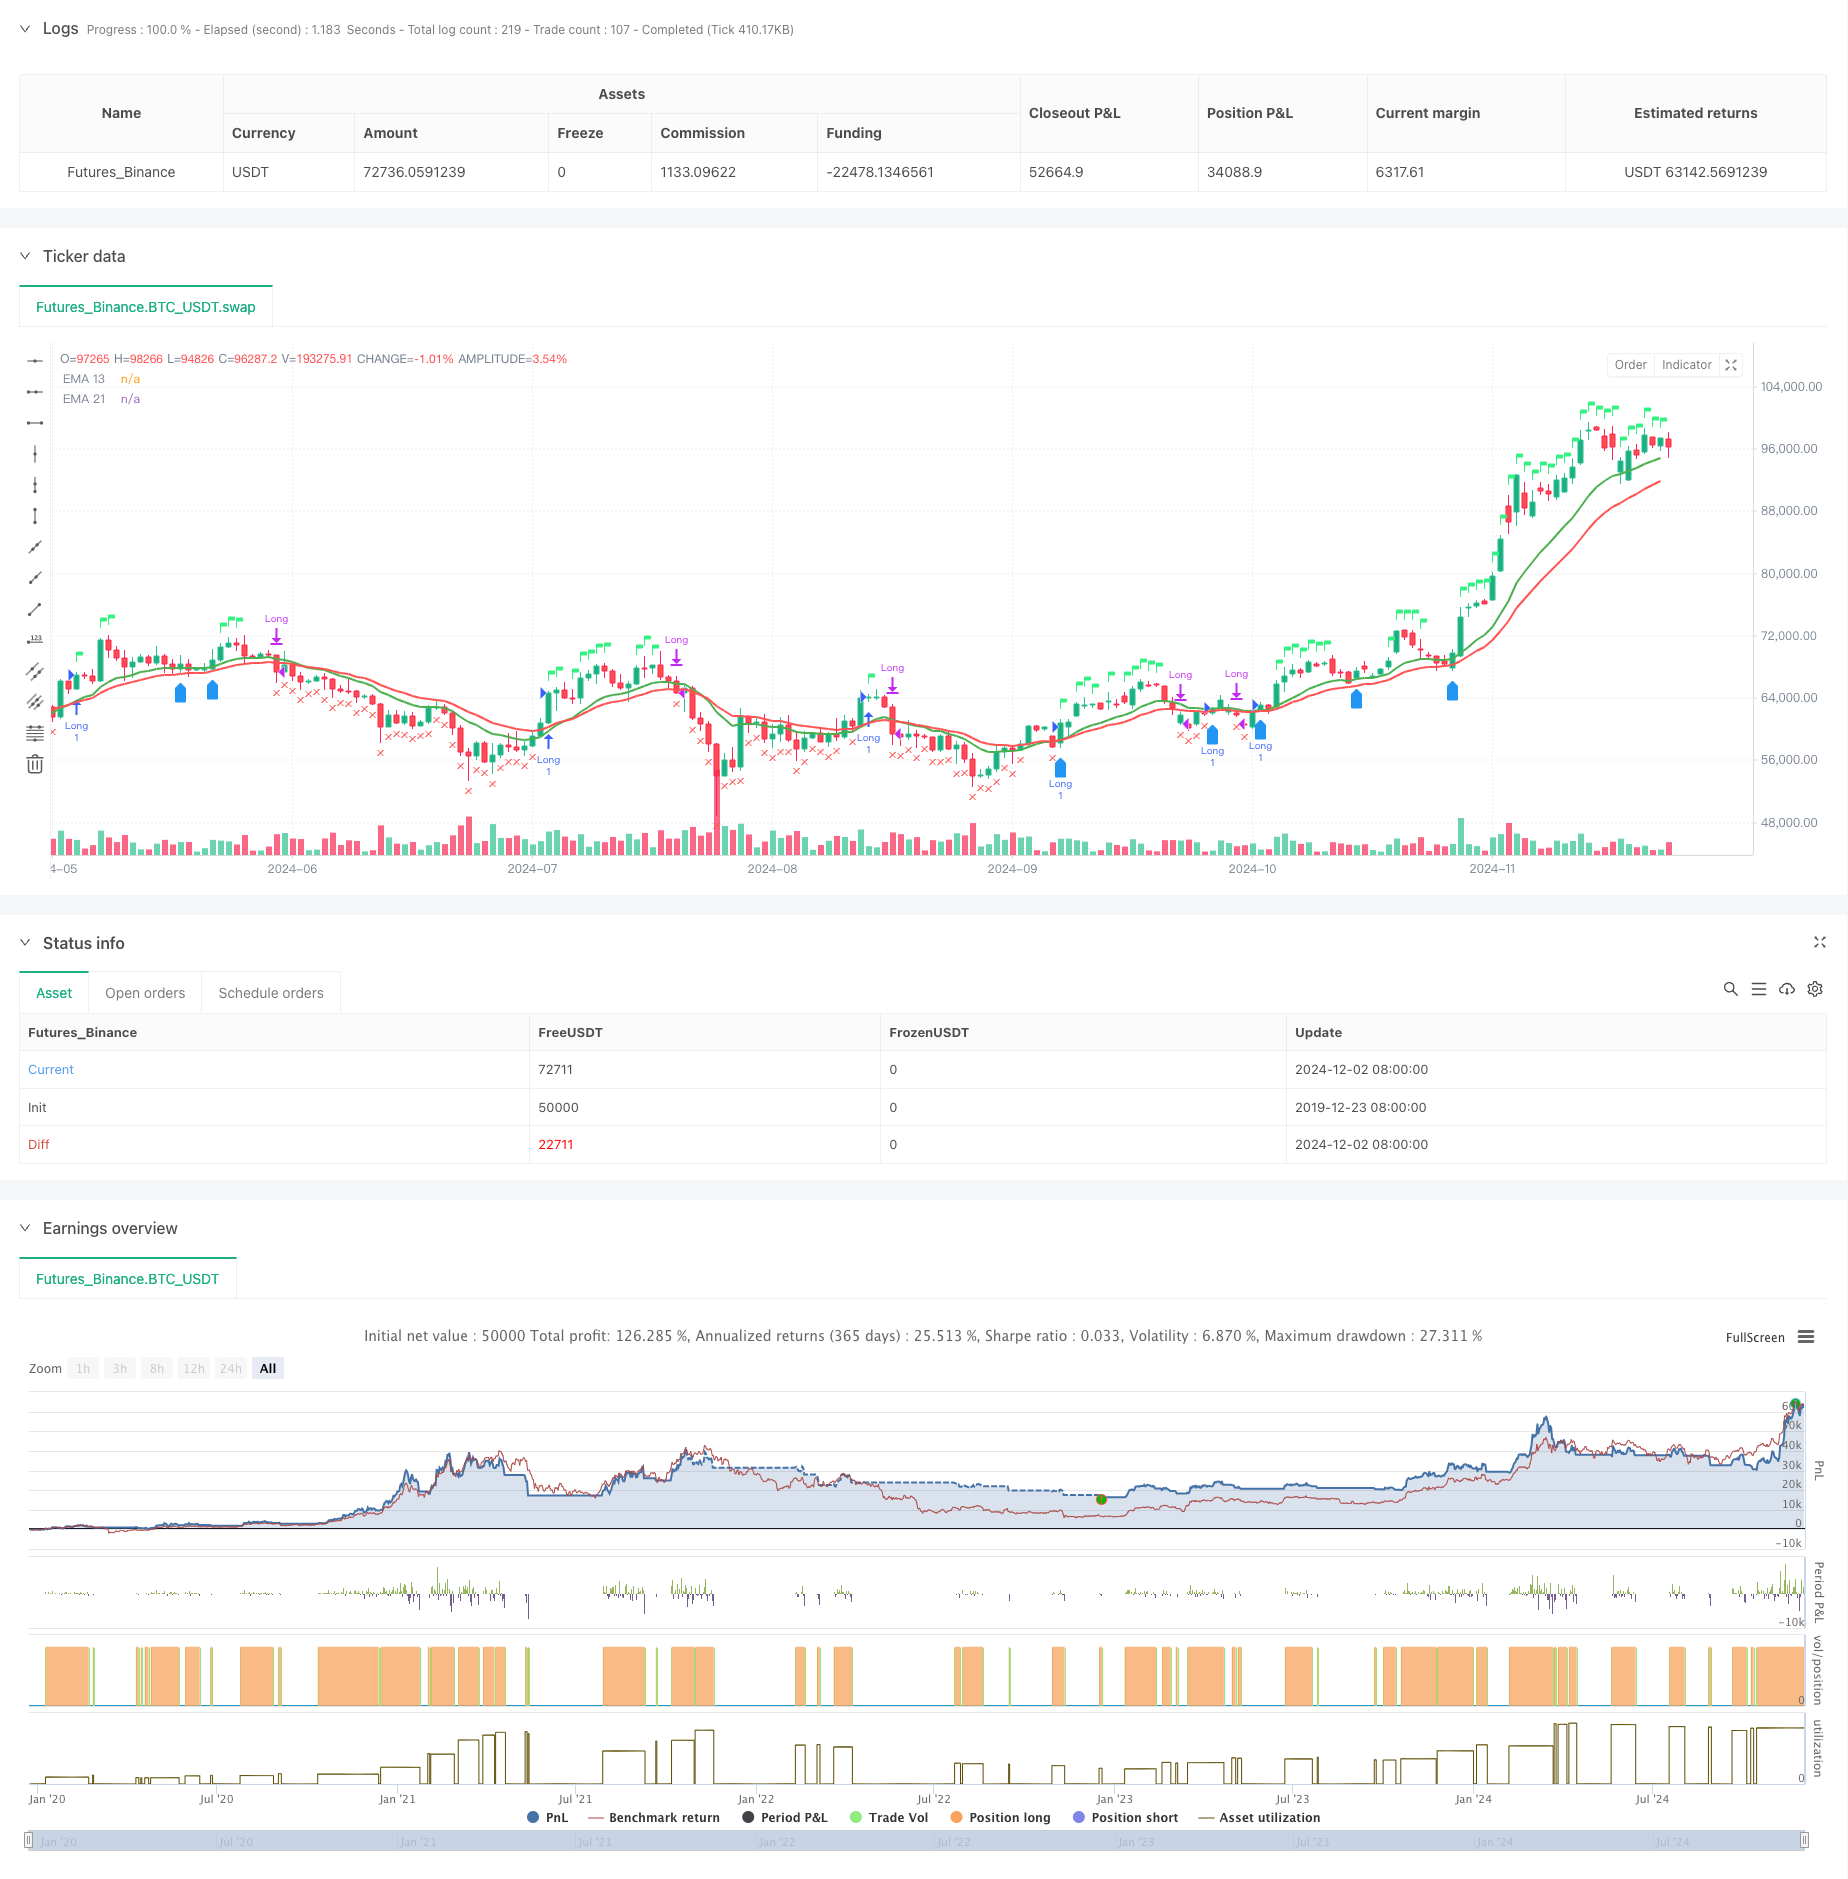
Princípio da estratégia
A estratégia usa um mecanismo de confirmação de múltiplos sinais:
- O sinal de entrada deve atender simultaneamente às seguintes condições:
- EMA13 com EMA21 ou preço superior a EMA13
- RSI maior que 60
- A intensidade relativa ((RS) é a positiva
- As condições para a saída incluem:
- Preços abaixo da EMA21
- RSI abaixo de 50
- RS transformado em negativo
- Reincidência:
- Preço superior a EMA13 e EMA13 maior que EMA21
- RS mantido em zero
- Ou o preço quebrou o pico da semana passada
Vantagens estratégicas
- Mecanismos de confirmação de múltiplos sinais reduzem o risco de falsas invasões
- Combinação de análise de intensidade relativa para seleção eficaz de variedades fortes
- Mecanismo de ajuste de ciclo de tempo adaptativo
- Um sistema de controlo de riscos adequado
- Mecanismos de reentrada inteligentes
- Oferece visualização de status de transação em tempo real
Risco estratégico
- Mercado turbulento pode gerar transações frequentes
- Dependência de múltiplos indicadores pode causar atraso no sinal
- Os limites fixos do RSI podem não ser adequados para todas as circunstâncias do mercado
- A precisão do cálculo da intensidade relativa depende do índice de referência
- O pico de 52 semanas pode ter sido muito relaxado
Direção de otimização da estratégia
- Introdução de um limiar RSI adaptável
- Otimização da lógica de julgamento das condições de reentrada
- Aumentar a dimensão da análise do volume de transações
- Melhore o mecanismo de stop-profit e stop-loss
- Adicionar filtro de taxa de flutuação
- Otimização do ciclo de cálculo de intensidade relativa
Resumir
A estratégia, através da combinação de análise técnica e análise de intensidade relativa, constrói um sistema de negociação abrangente. Seu mecanismo de confirmação de sinais múltiplos e sistema de controle de risco tornam-no de grande utilidade. Com a orientação de otimização sugerida, há espaço para uma estratégia de melhoria ainda maior. A implementação bem-sucedida da estratégia requer que o comerciante tenha uma profunda compreensão do mercado e ajuste os parâmetros apropriados de acordo com as características específicas da variedade de negociação.
/*backtest
start: 2019-12-23 08:00:00
end: 2024-12-03 00:00:00
period: 1d
basePeriod: 1d
exchanges: [{"eid":"Futures_Binance","currency":"BTC_USDT"}]
*/

//@version=5
strategy("EMA 13 & 21 Entry Exit", overlay=true)

// Define the EMAs
ema13 = ta.ema(close, 13)
ema21 = ta.ema(close, 21)

// Define the RSI
rsi = ta.rsi(close, 14)

// Calculate the closing price relative to Nifty 50
//nifty50 = request.security("NSE:NIFTY", timeframe.period, close)
//closeRelative = close / nifty50

// Define a base period (e.g., 123) and adjust it based on the timeframe
//basePeriod = 123

// Calculate the effective period based on the timeframe
//effectivePeriod = basePeriod * (timeframe.isintraday ? (60 / timeframe.multiplier) : 1)

// Calculate the EMA
//rs = ta.ema(closeRelative, effectivePeriod)

// Define the Relative Strength with respect to NIFTY 50
nifty50 = request.security("swap", "D", close)
rs = ta.ema(close / nifty50, 55 )

// Define the previous 2-week low and last week's high
twoWeekLow = ta.lowest(low, 10)  // 10 trading days roughly equal to 2 weeks
lastWeekHigh = ta.highest(high, 5)  // 5 trading days roughly equal to 1 week
fiftytwoWeekhigh = ta.highest(high, 52*5) // 252 tradingdays roughly equal to 52 week.

// Long condition: EMA 21 crossing above EMA 55, price above EMA 21, RSI > 50, and RS > 0
longCondition = ta.crossover(ema13, ema21) or close > ema13 and rsi > 60 and rs > 0

// Exit condition: Price closing below EMA 55 or below the previous 2-week low
exitCondition = close < ema21 or rsi < 50 or rs < 0 //or close < fiftytwoWeekhigh*0.80

// Re-entry condition: Price crossing above EMA 21 after an exit, EMA 21 > EMA 55, and RS > 1
reEntryCondition = ta.crossover(close, ema13) and ema13 > ema21 and rs > 0

// Re-entry condition if trailing stop loss is hit: Price crossing above last week's high
reEntryAfterSL = ta.crossover(close, lastWeekHigh)

// Plot the EMAs
plot(ema13 ,color=color.green, title="EMA 13",linewidth = 2)
plot(ema21, color=color.red, title="EMA 21",linewidth = 2)


// Plot buy and sell signals
plotshape(series=longCondition, location=location.abovebar, color=color.rgb(50, 243, 130), style=shape.flag, title="Buy Signal")
plotshape(series=exitCondition, location=location.belowbar, color=color.red, style=shape.xcross, title="Sell Signal")
plotshape(series=reEntryCondition or reEntryAfterSL, location=location.belowbar, color=color.blue, style=shape.labelup, title="Re-entry Signal")
//plotshape(series = fiftytwoWeekhigh,location=location.abovebar, color=color.blue,style=shape.flag, title="52WH")

// Plot background color for RS > 0
//bgcolor(rs > 0 ? color.new(color.green, 90) : na, title="RS Positive Background")
// Plot the previous 2-week low and last week's high
// plot(twoWeekLow, color=color.orange, title="2-Week Low")
// plot(lastWeekHigh, color=color.purple, title="Last Week High")

// Strategy logic
if (longCondition or reEntryCondition or reEntryAfterSL)
    strategy.entry("Long", strategy.long)

if (exitCondition)
    strategy.close("Long")

 // Calculate Stop Loss (SL) and Profit
var float entryPrice = na
var float stopLoss = na
var float profit = na

if (strategy.opentrades > 0)
    entryPrice := strategy.opentrades.entry_price(strategy.opentrades - 1)
    stopLoss := fiftytwoWeekhigh * 0.80
    profit := (close - entryPrice) / entryPrice * 100

// Display the strategy table
var table strategyTable = table.new(position.top_right, 4, 2, border_width = 1)

// Make the table movable
tableX = input.int(0, title="Table X Position")
tableY = input.int(0, title="Table Y Position")

// Add size options for the table
tableSize = input.string("small", title="Table Size", options=["tiny", "small", "large"])

// Adjust table size based on user input
tableWidth = tableSize == "tiny" ? 2 : tableSize == "small" ? 4 : 6
tableHeight = tableSize == "tiny" ? 1 : tableSize == "small" ? 2 : 3

// Create the table with the specified size
//table = table.new(position.top_right, tableWidth, tableHeight, border_width = 1)

// Position the table based on user input
// table.cell(strategyTable, tableX, tableY, "Entry Price",  bgcolor=#18eef9)
// table.cell(strategyTable, tableX, tableY + 1, str.tostring(entryPrice, format.mintick), bgcolor=#18eef9)
// table.cell(strategyTable, tableX + 1, tableY, "Stop Loss (20%)", bgcolor=color.red)
// table.cell(strategyTable, tableX + 1, tableY + 1, str.tostring(stopLoss, format.mintick), bgcolor=color.red)
// table.cell(strategyTable, tableX + 2, tableY, "Profit (%)", bgcolor=color.green)
// table.cell(strategyTable, tableX + 2, tableY + 1, str.tostring(profit, format.percent), bgcolor=color.green)