Ruptura de triângulo combinada com estratégia de momentum RSI

Visão geral
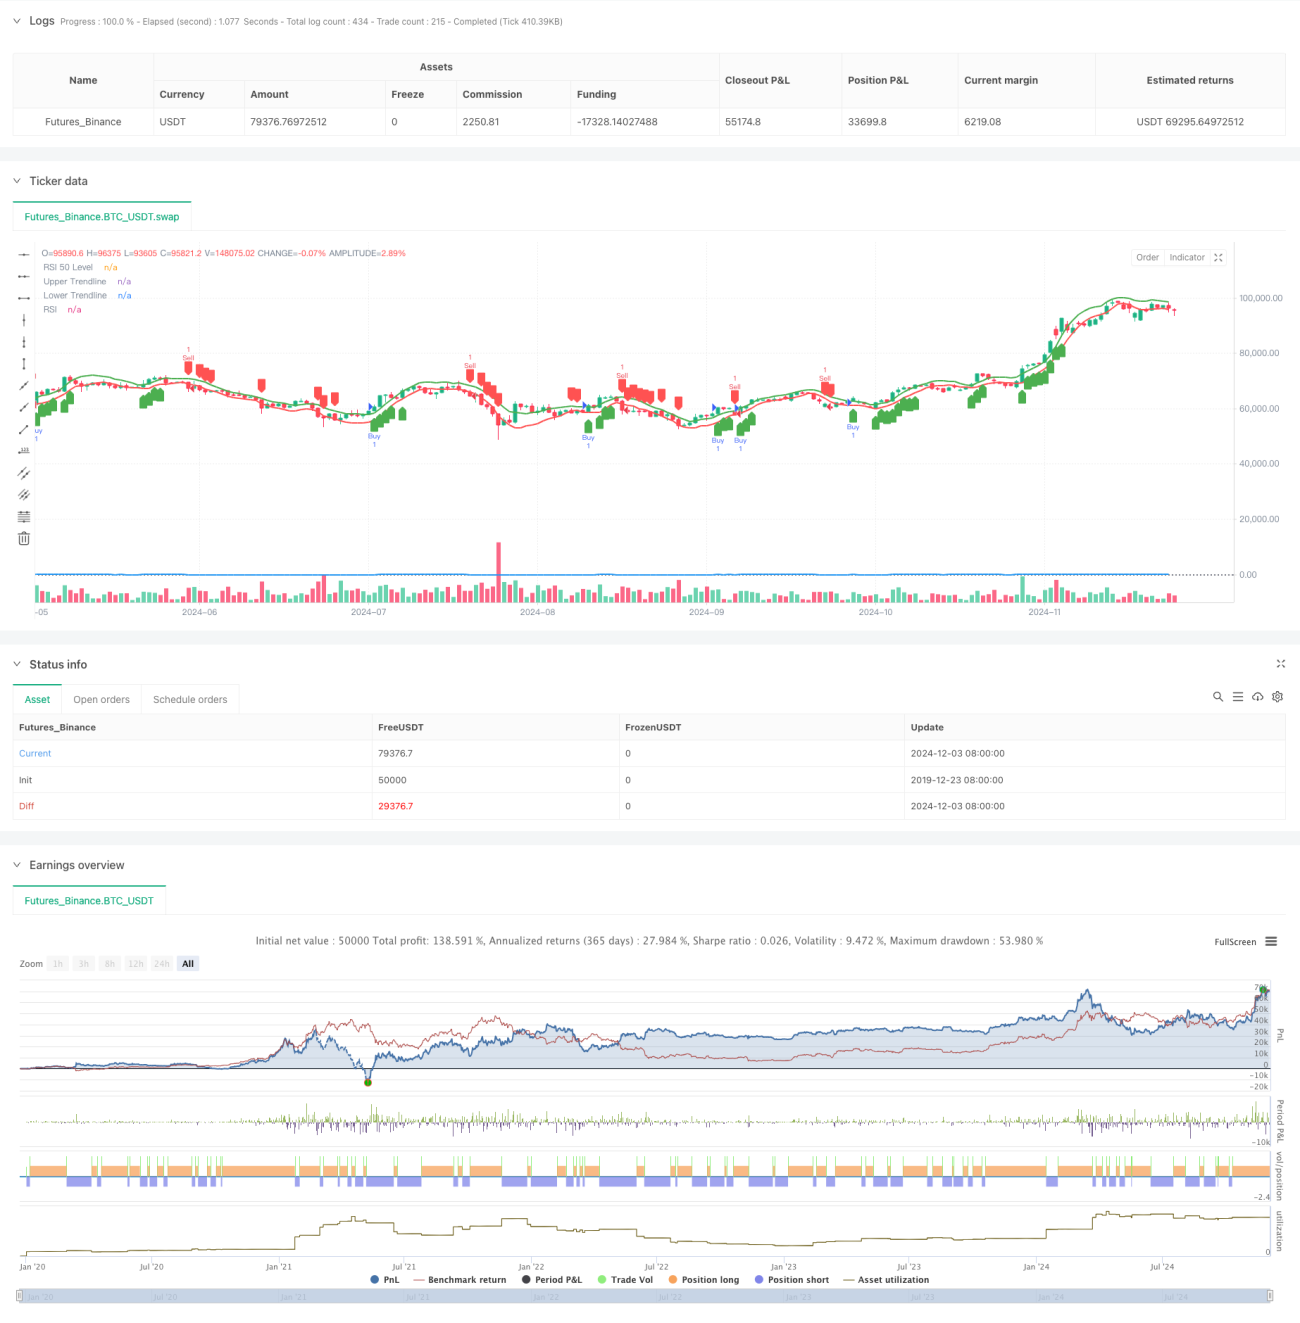
A estratégia é um sistema de negociação quantitativa baseado na combinação de forma de preço e indicadores técnicos. Ela é executada principalmente através da identificação de rupturas em forma de triângulo, e em combinação com a confirmação de dinâmica do indicador RSI. A estratégia usa o método de regressão linear para construir uma linha de tendência ascendente e descendente, determinando um sinal de negociação através da posição de ruptura de preço e RSI, realizando uma combinação orgânica de análise de forma e análise de dinâmica.
Princípio da estratégia
A lógica central da estratégia inclui duas partes principais: reconhecimento de forma triangular e confirmação de dinâmica RSI. Primeiro, o método de regressão linear é usado para calcular os altos e baixos dos últimos N ciclos, construindo uma linha de tendência ascendente para formar um triângulo. Quando o preço quebra a linha de tendência e o RSI é maior que 50, a ação de múltiplos sinais é acionada; Quando o preço quebra a linha de tendência e o RSI é menor que 50, a ação de sinais de vazio é acionada.
Vantagens estratégicas
- Claridade de estrutura: A estratégia combina organicamente a análise morfológica com a análise dinâmica, aumentando a confiabilidade das transações por meio da dupla confirmação.
- Flexibilidade de parâmetros: fornece um comprimento de triângulo ajustável e parâmetros de ciclo RSI para facilitar a otimização de diferentes características do mercado.
- Forte visualização: mostra claramente as linhas de tendência e os sinais de negociação nos gráficos, facilitando a monitorização estratégica e a análise de feedback.
- Risco controlado: O RSI funciona como um filtro e pode ser usado para reduzir o risco de falhas.
Risco estratégico
- A crise pode gerar transações frequentes e aumentar os custos de transação.
- A linha de tendência é calculada com base em dados históricos, que podem ser atrasados em mercados de rápida flutuação.
- O RSI pode produzir falsos sinais em certas condições de mercado.
- A estratégia não tem um mecanismo de parada de perdas e pode sofrer grandes perdas em situações de forte volatilidade no mercado.
Direção de otimização da estratégia
- Introdução de um mecanismo de stop loss: Recomenda-se a adição de stop loss fixo ou stop loss móvel para controlar o risco.
- Otimização do tempo de entrada: pode-se considerar aumentar a confirmação do volume de transações e aumentar a confiabilidade do sinal de ruptura.
- Melhorar a filtragem de sinais: pode ser adicionado um filtro de tendência para evitar a negociação frequente em mercados horizontais.
- Otimização de parâmetros dinâmicos: Recomenda-se ajustar o comprimento do triângulo e o limiar do RSI de acordo com a dinâmica da volatilidade do mercado.
Resumir
A estratégia de ruptura triangular combinada com a dinâmica do RSI é um sistema de negociação quantitativa com estrutura completa e lógica clara. O mecanismo de dupla confirmação de forma e dinâmica aumenta efetivamente a confiabilidade do sinal de negociação. Embora haja algum risco, a estratégia tem um bom valor prático através de medidas razoáveis de otimização de parâmetros e controle de risco.
- 1