Estratégia de negociação combinada de volatilidade de momentum RSI-ATR

Visão geral
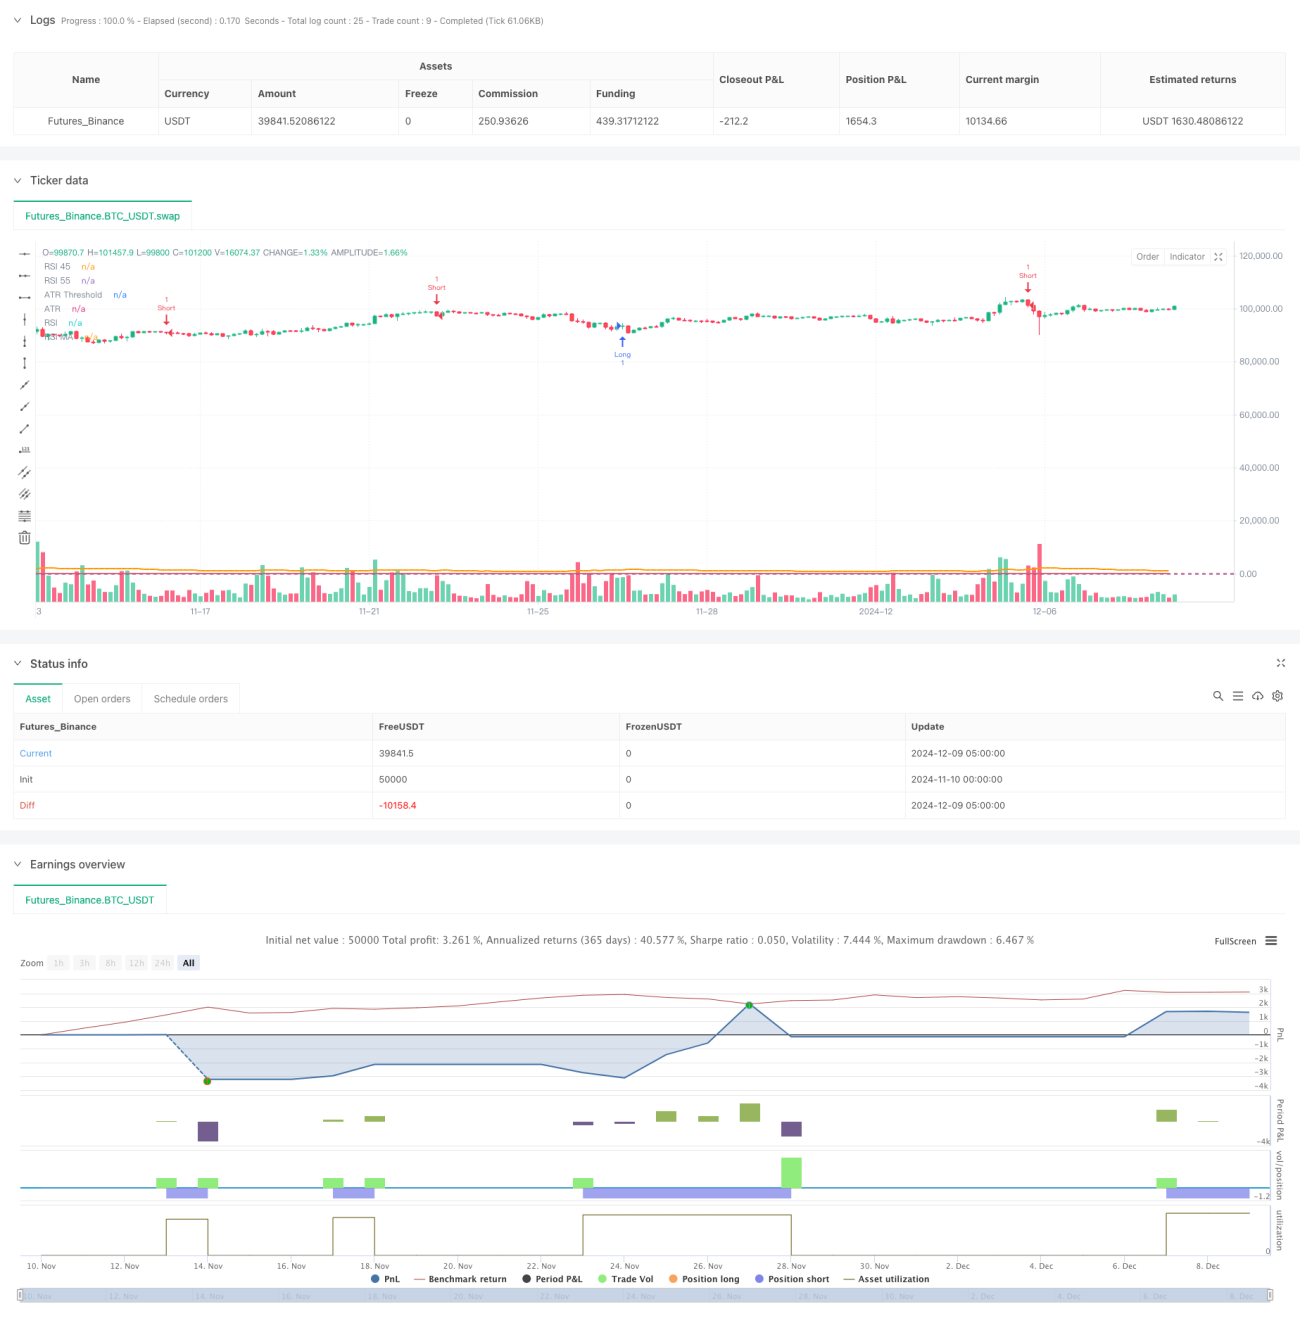
Trata-se de um sistema de estratégia de negociação que combina o indicador de volume RSI com o indicador de flutuação ATR. A estratégia identifica oportunidades de negociação potenciais monitorando a interseção do RSI com sua média móvel, enquanto usa o indicador ATR como um filtro de taxa de flutuação para garantir que o mercado tenha volatilidade suficiente. A estratégia opera durante o horário de negociação europeu ((horário de Praga 8:00-21:00), com um período de 5 minutos e um nível de stop loss fixo.
Princípio da estratégia
A lógica central da estratégia é baseada nos seguintes componentes principais:
- O indicador RSI é usado para identificar áreas de sobrecompra e sobrevenda, quando o RSI é inferior a 45 é considerado uma zona de sobrevenda e superior a 55 é considerado uma zona de sobrecompra
- O cruzamento do RSI com a sua média móvel como condição para o sinal de entrada
- O indicador ATR é usado para filtrar ambientes de baixa volatilidade, permitindo a negociação somente quando o ATR está acima do limiar definido
- O horário de negociação é limitado entre 8:00 e 21:00 hora de Praga
- A estratégia de stop-loss fixa é de 5000 pontos por defeito.
As regras de negociação são as seguintes:
- Multi-condicionamento: RSI abaixo de 45 cruza-se para cima com sua média móvel e satisfaz condições de tempo de negociação e de volatilidade
- Condição de fechamento: RSI acima de 55 cruzando para baixo com sua média móvel e atendendo a condições de tempo de negociação e volatilidade
- Condições de saída: toque no ponto de parada ou no ponto de parada automático
Vantagens estratégicas
- Mecanismo de filtragem múltipla: combina o indicador de força (RSI) e o indicador de oscilação (ATR) para reduzir efetivamente os sinais falsos
- Filtragem de tempo: evita interrupções em períodos de baixa liquidez, limitando a janela de tempo de negociação
- Gerenciamento de risco perfeito: configuração de stop loss fixo para facilitar a gestão de fundos
- Parâmetros ajustáveis: Parâmetros-chave como a duração do RSI, o valor mínimo do ATR e outros podem ser otimizados para diferentes situações de mercado
- Os resultados foram robustos: a taxa de vitória foi de 64,4%, com uma taxa de lucro e prejuízo de 1,1, levando em conta os pontos de deslizamento e as comissões.
Risco estratégico
- O stop loss fixo pode não ser adequado para todos os cenários de mercado e pode levar a saídas prematuras em períodos de forte volatilidade.
- Indicadores de RSI podem gerar falsos sinais frequentes em mercados de tendência
- A filtragem do ATR pode fazer com que a estratégia perca algumas oportunidades importantes de mercado
- Limitação de janela de tempo pode levar a perda de oportunidades de negociação de qualidade em outros períodos
- A estratégia depende da otimização de parâmetros, a otimização excessiva pode levar ao risco de sobreajuste
Direção de otimização da estratégia
- Stop loss dinâmico: pode-se considerar ajustar a amplitude do stop loss de acordo com a dinâmica do ATR, para torná-lo mais adaptado às flutuações do mercado
- Filtragem de tendências: aumentar os indicadores de tendências, como o sistema de médias móveis, para reduzir os falsos sinais em mercados turbulentos
- Alteração do horário de entrada: pode ser considerado o acréscimo de indicadores de tráfego como confirmação auxiliar para melhorar a qualidade de entrada
- Optimizar a janela de tempo: ajustar a janela de tempo de negociação de acordo com as características de diferentes mercados para capturar mais oportunidades
- Aumento do módulo de gestão de fundos: gestão dinâmica da dimensão das posições e melhor controlo dos riscos
Resumir
A estratégia, através da combinação de indicadores RSI e ATR, constrói um sistema de negociação relativamente completo. As principais vantagens da estratégia são o mecanismo de filtragem múltipla e o gerenciamento de risco perfeito, mas também existem algumas limitações.
- 1