Estratégia de acompanhamento de tendências multiindicador combinada com sistema de negociação de canal dinâmico e média móvel

Visão geral
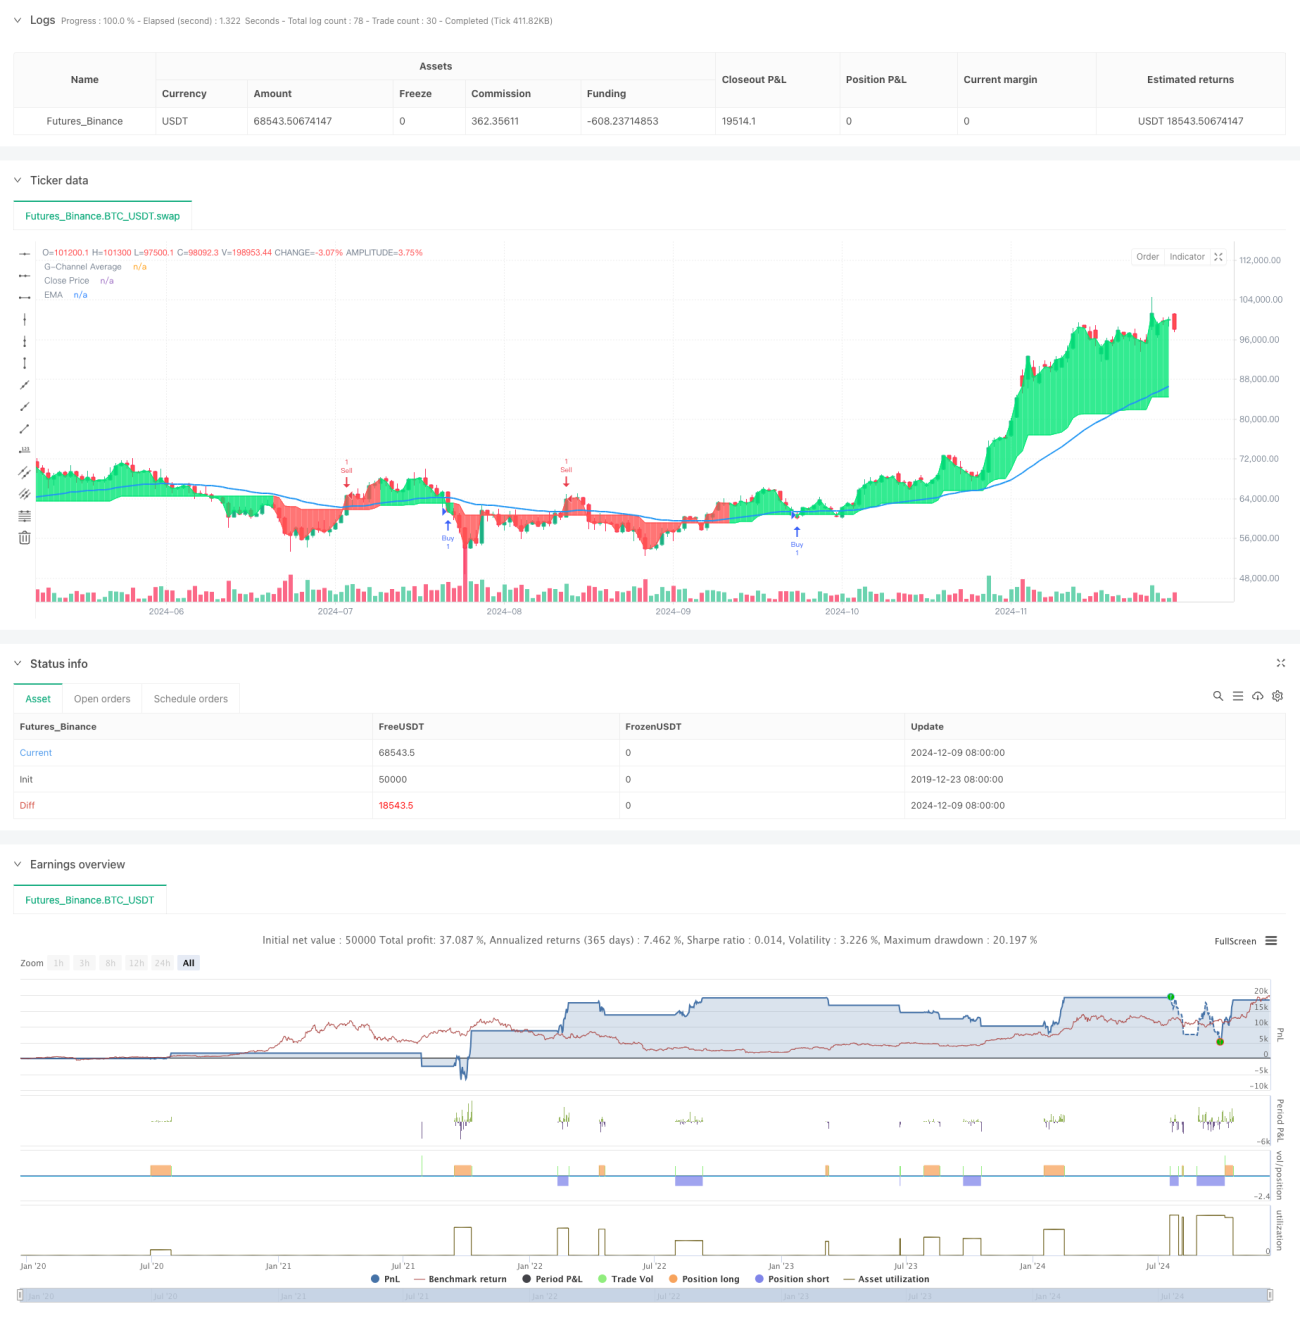
A estratégia é um sistema de negociação multi-indicador que combina o G-Channel, a média móvel do índice (EMA) e a amplitude de flutuação real (ATR). Identifica os sinais de negociação por meio de suporte/resistência dinâmicos e confirmação de tendências, e gerencia o risco usando paradas e paradas baseadas em ATR. O sistema foi projetado com foco em confiabilidade e controle de risco e é adequado para os comerciantes que buscam uma abordagem de negociação robusta.
Princípio da estratégia
A lógica central da estratégia baseia-se nos seguintes componentes-chave:
- O canal G calcula os níveis dinâmicos de suporte e resistência, ajustando-os continuamente para cima e para baixo através de fórmulas matemáticas
- A EMA é usada para confirmar a direção da tendência geral, e a posição do preço em relação à EMA determina a direção da negociação.
- Sinais de entrada baseados em ruptura do canal G e confirmação de posição do EMA
- Use o múltiplo do ATR para configurar o stop loss e o stop loss com 2x o ATR e o stop loss com 4x o ATR
- Evite sinais repetitivos por meio de rastreamento de status
Vantagens estratégicas
- Mecanismos de confirmação de sinais em vários níveis aumentam a confiabilidade das transações
- Fronteiras de corredor adaptadas dinamicamente a diferentes circunstâncias de mercado
- Gestão de risco baseada na volatilidade é mais adaptativa
- Evitar sinais repetidos reduz o risco de excesso de negociação
- Marcas de compra e venda visíveis para facilitar a análise e o feedback
Risco estratégico
- Os mercados horizontais podem gerar muitos falsos sinais de ruptura
- EMA como indicador de atraso pode causar atraso no tempo de entrada
- O stop loss ATR de multiplicador fixo pode não ser suficientemente flexível em períodos de alta volatilidade
- Indicadores que requerem dados históricos mais longos
- A otimização de parâmetros pode levar ao overfitting
Direção de otimização da estratégia
- Introdução de sinais de confirmação de tráfego para aumentar a confiabilidade da brecha
- Ajuste dinâmico do múltiplo ATR para adaptar-se a diferentes situações de mercado
- Adição de filtros de mercado para evitar transações em condições adversas
- Otimização da lógica de filtragem de sinais para reduzir ainda mais os falsos sinais
- Considere a inclusão de um sistema de gestão de posições dinâmico
Resumir
A estratégia é construída em um sistema de negociação completo, através da combinação de vários indicadores técnicos bem-sucedidos. A vantagem do sistema reside no seu mecanismo de confirmação de sinais em vários níveis e na gestão de risco baseada na volatilidade, mas ainda requer otimização de acordo com as características específicas do mercado na aplicação real.
- 1