Estratégia de negociação de reversão e acompanhamento de tendência de preço de equilíbrio múltiplo

ATR SL TP
Data de criação: 2024-12-13 10:23:12 última modificação: 2024-12-13 10:23:12
cópia: 0 Cliques: 364
1
focar em
1617
Seguidores

Estratégia de negociação de reversão e acompanhamento de tendência de preço de equilíbrio múltiplo

Visão geral da estratégia

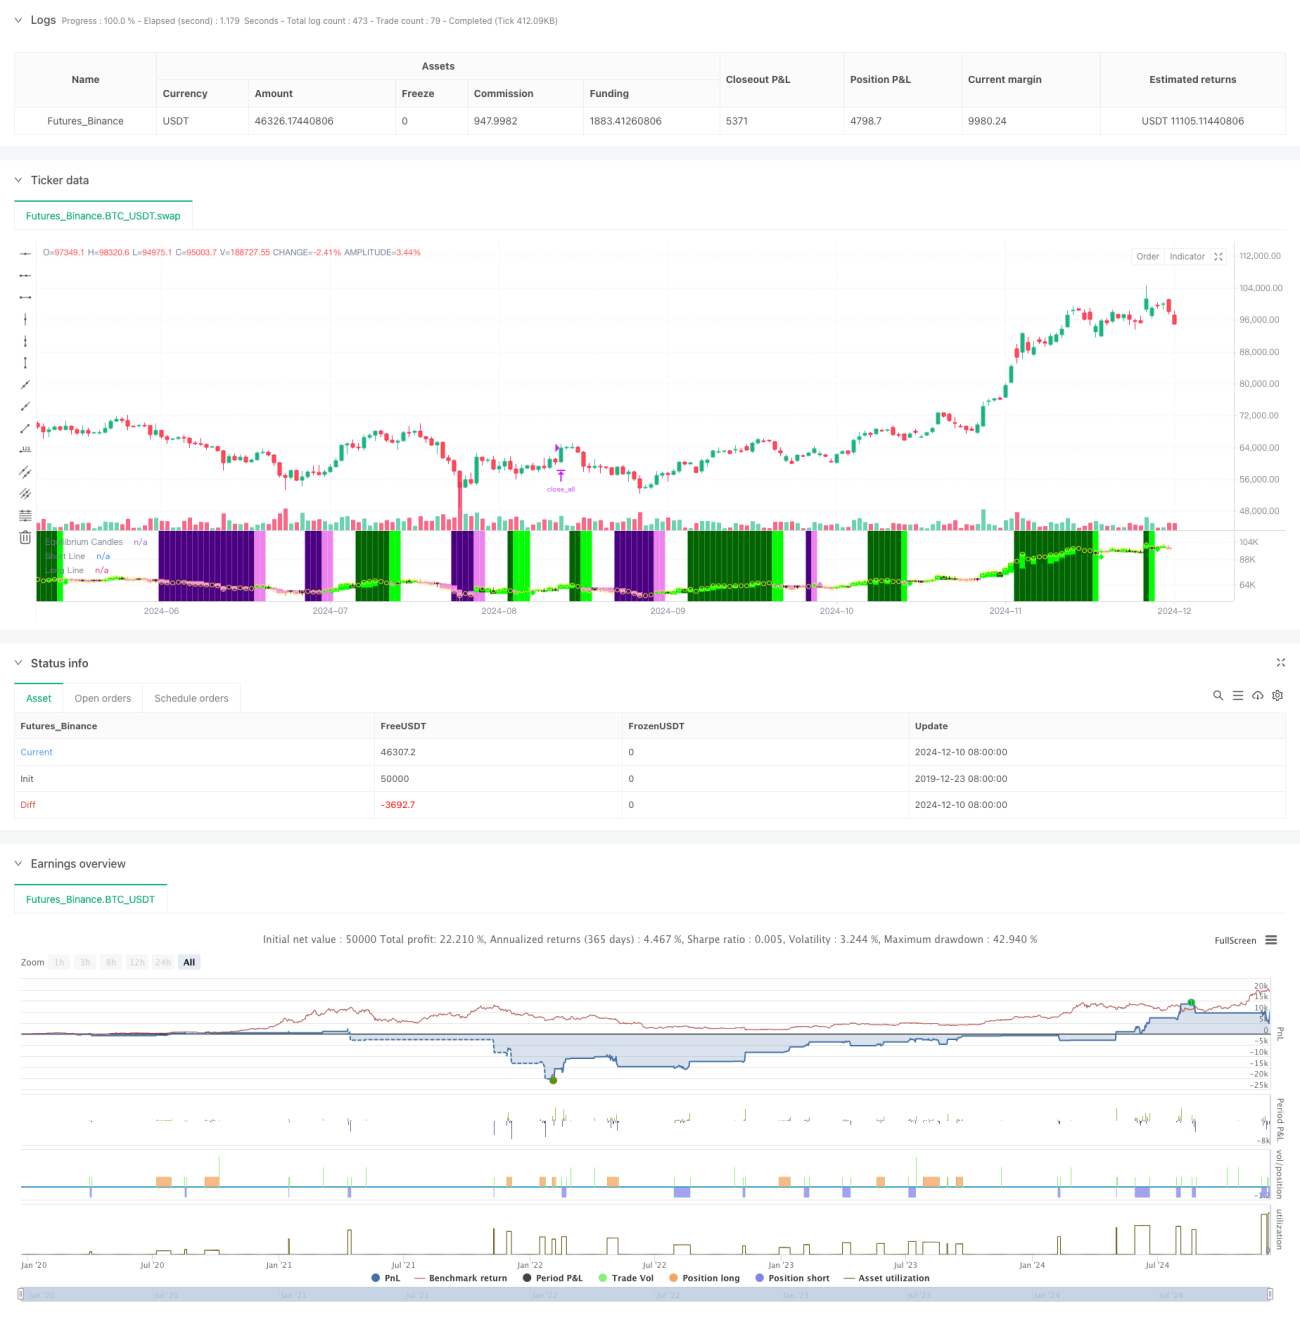
A estratégia é um sistema de negociação de acompanhamento e reversão de tendências baseado no ponto de equilíbrio de preços. Ela determina o preço de equilíbrio calculando o valor médio dos pontos mais altos e mais baixos da linha K da raiz X do passado e julga a direção da tendência com base na posição do preço de encerramento em relação ao preço de equilíbrio.

Princípio da estratégia

  1. Preço de equilíbrio: o preço de equilíbrio é calculado usando o valor médio do preço mais alto e o preço mais baixo da linha K da raiz X como preço de equilíbrio, o que é o mesmo que o método de cálculo da linha de referência do gráfico de equilíbrio.
  2. Julgamento de tendência: quando o preço mantém a linha K da raiz X continuamente do mesmo lado do preço de equilíbrio (a raiz 7 padrão), a tendência é estabelecida.
  3. O sinal de entrada: a primeira retracção após a definição de uma tendência (preço quebra o preço de equilíbrio) é a causa do sinal de entrada.
  4. Paragem de perda: usa a pontuação de 60% do ATR para ajustar dinamicamente a distância de parada de perda, oferecendo flexibilidade para o controle de risco.
  5. Proteção contra grandes flutuações: Quando o preço se desvia do ponto de equilíbrio e excede o multiplicador ATR definido, o sistema elimina automaticamente as posições para evitar grandes retrações.

Vantagens estratégicas

  1. Adaptabilidade: pode-se alternar de forma flexível de acordo com as características do mercado, seguindo tendências e revertendo o modelo de negociação.
  2. Controle de risco perfeito: uso de stop loss ATR dinâmico e mecanismo de proteção contra grandes flutuações.
  3. Claridade de operação: os sinais de negociação são claros e não dependem de uma combinação complexa de indicadores técnicos.
  4. A visualização é boa: a utilização de linhas K coloridas e de um fundo para fornecer uma visualização intuitiva do estado do mercado.
  5. Automatização: pode ser facilmente emparelhado com plataformas de negociação como MT5 para realizar transações automatizadas.

Risco estratégico

  1. Risco de mercado de choque: Falso sinal pode ser frequente em mercados de choque horizontal.
  2. Efeitos de deslizamento: pode haver um deslizamento maior em situações de forte flutuação.
  3. Sensibilidade de parâmetros: os parâmetros centrais, como o período de equilíbrio, o ciclo de avaliação de tendências, etc., precisam ser cuidadosamente otimizados para diferentes mercados.
  4. Risco de troca de mercado: a transição do mercado de tendência para turbulência pode causar uma grande retração.

Direção de otimização da estratégia

  1. Identificação do cenário de mercado: adicionar módulo de julgamento do cenário de mercado, ajustar dinamicamente os parâmetros de estratégia em diferentes condições de mercado.
  2. Filtragem de sinais: Considere adicionar indicadores auxiliares, como volume de tráfego e taxa de flutuação, para filtrar sinais falsos.
  3. Gerenciamento de posições: introdução de mecanismos de gerenciamento de posições mais complexos, como o ajuste dinâmico baseado na volatilidade.
  4. Múltiplo período de tempo: integração de sinais de vários períodos de tempo para melhorar a precisão das transações.
  5. Otimização de custos de transação: Otimização de características de custo para diferentes variedades de transação.

Resumir

Trata-se de um sistema de negociação de tendências concebido de forma razoável, que fornece uma lógica de negociação clara através do conceito central de preços equilibrados. A maior característica da estratégia é a flexibilidade, que pode ser usada tanto para o acompanhamento de tendências quanto para a negociação de reversão, com um mecanismo de controle de risco perfeito. Embora possa enfrentar desafios em certas condições de mercado, a estratégia espera manter um desempenho estável em vários ambientes de mercado por meio de otimização contínua e ajustes flexíveis.

Código-fonte da estratégia
/*backtest
start: 2019-12-23 08:00:00
end: 2024-12-11 08:00:00
period: 1d
basePeriod: 1d
exchanges: [{"eid":"Futures_Binance","currency":"BTC_USDT"}]
*/

// This Pine Script™ code is subject to the terms of the Mozilla Public License 2.0 at https://mozilla.org/MPL/2.0/
// © Honestcowboy

//@version=5
strategy("Equilibrium Candles + Pattern [Honestcowboy]", overlay=false)

// ================================== //
// ---------> User Input <----------- //
// ================================== //

candleSmoothing = input.int(9, title="Equilibrium Length", tooltip="The lookback for finding equilibrium.\nIt is same calculation as the Baseline in Ichimoku Cloud and is the mid point between highest and lowest value over this length.", group="Base Settings")
candlesForTrend = input.int(7, title="Candles needed for Trend", tooltip="The amount of candles in one direction (colored) before it's considered a trend.\nOrders get created on the first candle in opposite direction.", group="Base Settings")
maxPullbackCandles = input.int(2, title="Max Pullback (candles)", tooltip="The amount of candles can go in opposite direction until a pending trade order is cancelled.", group="Base Settings")
candle_bull_c1 = input.color(color.rgb(0,255,0), title="", inline="1", group="Candle Coloring")
candle_bull_c2 = input.color(color.rgb(0,100,0), title="", inline="1", group="Candle Coloring")
candle_bear_c1 = input.color(color.rgb(238,130,238), title="", inline="2", group="Candle Coloring")
candle_bear_c2 = input.color(color.rgb(75,0,130), title="", inline="2", group="Candle Coloring")
highlightClosePrices = input.bool(defval=true, title="Highlight close prices", group="Candle Coloring", tooltip="Will put small yellow dots where closing price would be.")
useBgColoring = input.bool(defval=true, title="color main chart Bg based on trend and entry point", tooltip="colors main chart background based on trend and entry points", group="Chart Background")
trend_bull_c = input.color(color.rgb(0,100,0,50), title="Trend Bull Color", group="Chart Background")
trend_bear_c = input.color(color.rgb(75,0,130, 50), title="Trend Bear Color", group="Chart Background")
long_zone_c = input.color(color.rgb(0,255,0,60), title="Long Entry Zone Color", group="Chart Background")
short_zone_c = input.color(color.rgb(238,130,238,60), title="Short Entry Zone Color", group="Chart Background")
atrLenghtScob = input.int(14, title="ATR Length", group = "Volatility Settings")
atrAverageLength = input.int(200, title="ATR percentile averages lookback", group = "Volatility Settings")
atrPercentile    = input.int(60, minval=0, maxval=99, title="ATR > bottom X percentile", group = "Volatility Settings", tooltip="For the Final ATR value in which percentile of last X bars does it need to be a number. At 60 it's the lowest ATR in top 40% of ATR over X bars")
useReverse = input.bool(true, title="Use Reverse", group="Strategy Inputs", tooltip="The Strategy will open short orders where normal strategy would open long orders. It will use the SL as TP and the TP as SL. So would create the exact opposite in returns as the normal strategy.")
stopMultiplier = input.float(2, title="stop+tp atr multiplier", group="Strategy Inputs")
useTPSL = input.bool(defval=true, title="use stop and TP", group="Strategy Inputs")
useBigCandleExit = input.bool(defval=true, title="Big Candle Exit", group="Strategy Inputs", inline="1", tooltip="Closes all open trades whenever price closes too far from the equilibrium")
bigCandleMultiplier = input.float(defval=1, title="Exit Multiplier", group="Strategy Inputs", inline="1", tooltip="The amount of times in ATR mean candle needs to close outside of equilibrium for it to be a big candle exit.")

tvToQPerc = input.float(defval=1, title="Trade size in Account risk %", group="Tradingview.to Connection (MT5)", tooltip="Quantity as a percentage with stop loss in the commands; the lot size is calculated based on the percentage to lose in case sl is hit. If SL is not specified, the Lot size will be calculated based on account balance.")
tvToOverrideSymbol = input.bool(defval=false, title="Override Symbol?", group="Tradingview.to Connection (MT5)")
tvToSymbol = input.string(defval="EURUSD", title="", group="Tradingview.to Connection (MT5)")
// ================================== //
// -----> Immutable Constants <------ //
// ================================== // 

var bool isBullTrend = false
var bool isBearTrend = false
var bool isLongCondition = false
var bool isShortCondition = false
var int bullCandleCount = 0
var int bearCandleCount = 0
var float longLine = na
var float shortLine = na

// ================================== //
// ---> Functional Declarations <---- //
// ================================== //

baseLine(len) =>
    math.avg(ta.lowest(len), ta.highest(len))

// ================================== //
// ----> Variable Calculations <----- //
// ================================== //

longSignal = false
shortSignal = false

equilibrium = baseLine(candleSmoothing)
atrEquilibrium = ta.atr(atrLenghtScob)
atrAveraged = ta.percentile_nearest_rank(atrEquilibrium, atrAverageLength, atrPercentile)
equilibriumTop  = equilibrium + atrAveraged*bigCandleMultiplier
equilibriumBottom = equilibrium - atrAveraged*bigCandleMultiplier

// ================================== //
// -----> Conditional Variables <---- //
// ================================== //
if not isBullTrend and close>equilibrium
    bullCandleCount := bullCandleCount + 1
    bearCandleCount := 0
    isBearTrend := false

if not isBearTrend and close<equilibrium
    bearCandleCount := bearCandleCount + 1
    bullCandleCount := 0
    isBullTrend := false

if bullCandleCount >= candlesForTrend
    isBullTrend := true
    isBearTrend := false
    bullCandleCount := 0
    bearCandleCount := 0
if bearCandleCount >= candlesForTrend
    isBearTrend := true
    isBullTrend := false
    bullCandleCount := 0
    bearCandleCount := 0

// ================================== //
// ------> Strategy Execution <------ //
// ================================== //

if isBullTrend[1] and close<equilibrium
    if useReverse and (not na(atrAveraged))
        strategy.entry("short", strategy.short, limit=high)
        alert("Sell " + str.tostring((tvToOverrideSymbol ? tvToSymbol : syminfo.ticker)) + " Q=" + str.tostring(tvToQPerc) + "% P=" + str.tostring(high) + " TP=" + str.tostring(high-stopMultiplier*atrAveraged)+ " SL=" + str.tostring(high+stopMultiplier*atrAveraged), freq=alert.freq_once_per_bar)
    if (not useReverse) and (not na(atrAveraged))
        strategy.entry("long", strategy.long, stop=high)
        alert("Buy " + str.tostring((tvToOverrideSymbol ? tvToSymbol : syminfo.ticker)) + " Q=" + str.tostring(tvToQPerc) + "% P=" + str.tostring(high) + " TP=" + str.tostring(high+stopMultiplier*atrAveraged) + " SL=" + str.tostring(high+stopMultiplier*atrAveraged), freq=alert.freq_once_per_bar)
    isLongCondition := true
    isBullTrend := false
    longLine := high

if isBearTrend[1] and close>equilibrium
    if useReverse and (not na(atrAveraged))
        strategy.entry("long", strategy.long, limit=low)
        alert("Buy " + str.tostring((tvToOverrideSymbol ? tvToSymbol : syminfo.ticker)) + " Q=" + str.tostring(tvToQPerc) + "% P=" + str.tostring(low) + " TP=" + str.tostring(low+stopMultiplier*atrAveraged) + " SL=" + str.tostring(low-stopMultiplier*atrAveraged), freq=alert.freq_once_per_bar)
    if (not useReverse) and (not na(atrAveraged))
        strategy.entry("short", strategy.short, stop=low)
        alert("Sell " + str.tostring((tvToOverrideSymbol ? tvToSymbol : syminfo.ticker)) + " Q=" + str.tostring(tvToQPerc) + "% P=" + str.tostring(low) + " TP=" + str.tostring(low-stopMultiplier*atrAveraged) + " SL=" + str.tostring(low+stopMultiplier*atrAveraged), freq=alert.freq_once_per_bar)
    isShortCondition := true
    isBearTrend := false
    shortLine := low

if isLongCondition and (bearCandleCount >= maxPullbackCandles)[1]
    if useReverse
        strategy.cancel("short")
        alert("Cancel " + str.tostring((tvToOverrideSymbol ? tvToSymbol : syminfo.ticker)) + " t=sell")
    if not useReverse
        strategy.cancel("long")
        alert("Cancel " + str.tostring((tvToOverrideSymbol ? tvToSymbol : syminfo.ticker)) + " t=buy")
    isLongCondition := false
    bullCandleCount := 0
    longLine := na

if isShortCondition and (bullCandleCount >= maxPullbackCandles)[1]
    if useReverse
        strategy.cancel("long")
        alert("Cancel " + str.tostring((tvToOverrideSymbol ? tvToSymbol : syminfo.ticker)) + " t=buy")
    if not useReverse
        strategy.cancel("short")
        alert("Cancel " + str.tostring((tvToOverrideSymbol ? tvToSymbol : syminfo.ticker)) + " t=sell")
    isShortCondition := false
    bearCandleCount := 0
    shortLine := na
    
// ---- Save for graphical display that there is a longcondition + reset other variables
if high>longLine
    longSignal := true
    longLine := na
    isLongCondition := false

if low<shortLine
    shortSignal := true
    shortLine := na
    isShortCondition := false
// ---- Get Stop loss and Take Profit in there
if useReverse
    if useTPSL
        if strategy.position_size < 0 and strategy.position_size[1] >= 0
            strategy.exit("short exit", "short", limit=longLine[1]-stopMultiplier*atrAveraged, stop=longLine[1]+stopMultiplier*atrAveraged)
        if strategy.position_size > 0 and strategy.position_size[1] <= 0
            strategy.exit("long exit", "long", limit=shortLine[1]+stopMultiplier*atrAveraged, stop=shortLine[1]-stopMultiplier*atrAveraged)
if not useReverse
    if useTPSL
        if strategy.position_size > 0 and strategy.position_size[1] <= 0
            strategy.exit("long exit", "long", limit=longLine[1]+stopMultiplier*atrAveraged, stop=longLine[1]-stopMultiplier*atrAveraged)
        if strategy.position_size < 0 and strategy.position_size[1] >=0
            strategy.exit("short exit", "short", limit=shortLine[1]-stopMultiplier*atrAveraged, stop=shortLine[1]+stopMultiplier*atrAveraged)
// ----- Logic for closing positions on a big candle in either direction
if (strategy.position_size[1]>0 or strategy.position_size[1]<0) and useBigCandleExit
    if close>equilibriumTop or close<equilibriumBottom
        strategy.close_all("Big Candle Stop")
        alert("close " + str.tostring((tvToOverrideSymbol ? tvToSymbol : syminfo.ticker)))

// ================================== //
// ------> Graphical Display <------- //
// ================================== //

// Deviation from equilibrium using smoothed ATR and percentile nearest rank to rank the coloring of the candles
candle_c2 = close>equilibrium ? close>open ? candle_bull_c1 : candle_bull_c2 : close<open ? candle_bear_c1 : candle_bear_c2
// 
plotcandle(equilibrium, high, low, close, title="Equilibrium Candles", color=candle_c2, wickcolor=candle_c2, bordercolor=candle_c2)
plotshape(highlightClosePrices ? close : na, title="Closing Bubble", style=shape.circle, location=location.absolute, color=color.yellow)
bgcolor(useBgColoring ? (isBullTrend ? trend_bull_c : isBearTrend ? trend_bear_c : isLongCondition ? long_zone_c : isShortCondition ? short_zone_c : na) : na, force_overlay=true)
plot(longLine, color=candle_bull_c1, title="Long Line", style=plot.style_linebr, linewidth=4)
plot(shortLine, color=candle_bear_c1, title="Short Line", style=plot.style_linebr, linewidth=4)
plotshape(longSignal ? math.min(equilibrium, low)+(-0.5*atrAveraged) : na, title="Long Signal", color=candle_bull_c1, style=shape.diamond, size=size.tiny, location=location.absolute)
plotshape(shortSignal ? math.max(equilibrium, high)+(0.5*atrAveraged) : na, title="Short Signal", color=candle_bear_c1, style=shape.diamond, size=size.tiny, location=location.absolute)

// =================================== //
// ------> Simple Form Alerts <------- //
// =================================== //

alertcondition(longSignal, "Simple Long Signal")
alertcondition(shortSignal, "Simple Short Signal")