Estratégia de cruzamento de momento de tendência MACD-RSI combinada com modelo de gerenciamento de risco

1
Follow
1781
Followers
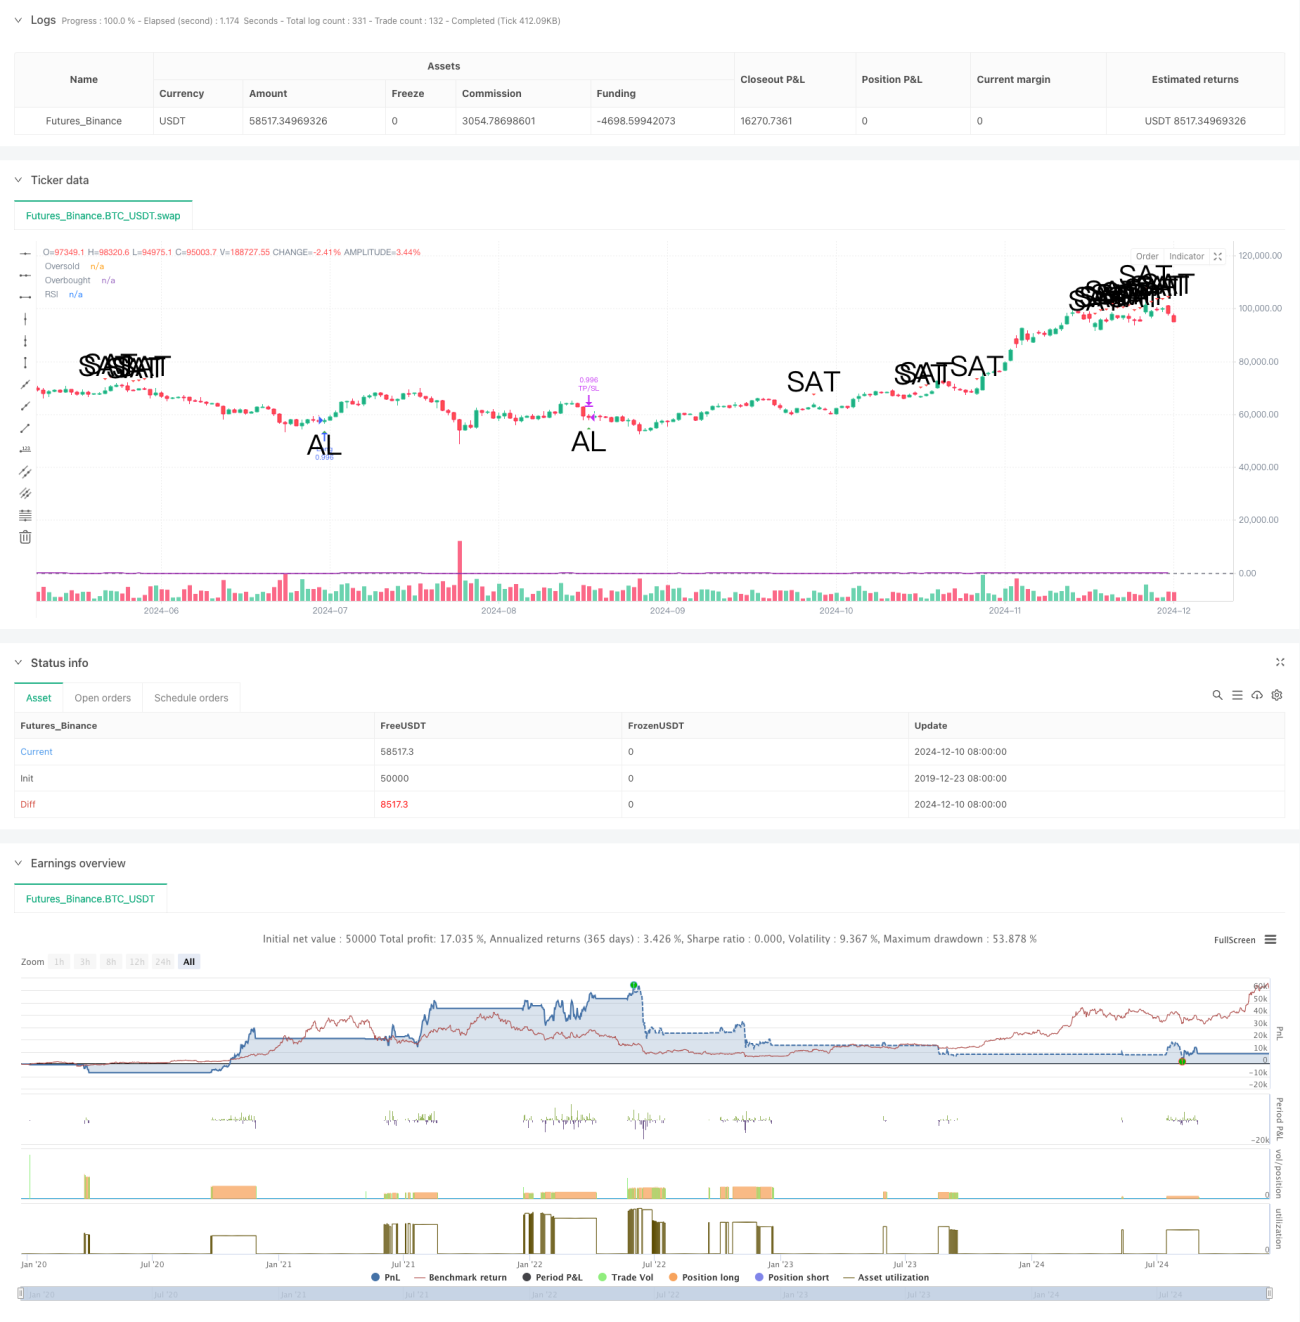
Visão geral
A estratégia é um sistema de negociação de acompanhamento de tendências que combina o MACD (Moving Average Convergence Scatter) e o RSI (Relatively Strong Indicator). A estratégia funciona em períodos de tempo de 5 minutos, gerando sinais de negociação através da análise do cruzamento do MACD com a linha de sinalização e o nível de venda e venda do RSI.
Princípio da estratégia
A estratégia baseia-se principalmente na seguinte lógica central:
- Indicador MACD com configuração de 12-26-9 para capturar tendências de preços
- O indicador RSI de 14 ciclos identifica o estado de sobrecompra e sobrevenda
- Quando o MACD atravessa a linha de sinalização e o RSI é inferior a 45, a ação de multi-sinal é acionada
- Quando o MACD atravessa a linha de sinalização offline e o RSI é superior a 55, o sinal de equilíbrio é acionado
- Estabelecer um stop loss de 1,2% para controlar o risco e um stop loss de 2,4% para bloquear o lucro
- Usar 10 ciclos EMA como um filtro de tendência para melhorar a qualidade do sinal
Vantagens estratégicas
- A combinação de indicadores permite capturar os pontos de inflexão do mercado com maior precisão
- Controle de risco perfeito: uso de stop-loss de proporção fixa, controle rigoroso de risco de transação individual
- Mecanismo de confirmação de sinais: é necessário atender simultaneamente às condições MACD e RSI para abrir uma posição, reduzindo os sinais falsos
- Adaptabilidade: pode ser ajustado com parâmetros para adaptar-se a diferentes condições de mercado
- Claridade de lógica de execução: regras de negociação claras e fácil de automatizar
Risco estratégico
- Risco de mercado de turbulência: o risco de perdas em mercados de turbulência horizontal pode ocasionar perdas em operações frequentes.
- Risco de deslizamento: com frequência de negociação em ciclos de 5 minutos, pode haver um deslizamento maior
- Risco de falha: sinal de cruzamento MACD pode ter falha
- Sensibilidade de parâmetros: a configuração de parâmetros do indicador tem maior influência no desempenho da estratégia
- Dependência do cenário de mercado: estratégias de melhor desempenho em mercados com tendências claras
Direção de otimização da estratégia
- Adição de filtro de transmissão: consideração do fator de transmissão na geração de sinais, aumentando a confiabilidade do sinal
- Parar Dinâmico: Ajustar a proporção de paragem de acordo com a volatilidade do mercado
- Introdução de filtros de força de tendência: aumento de indicadores de força de tendência, como o ADX, para otimizar o tempo de negociação
- Perfeccionar a gestão de posições: Implementar um controlo de posições dinâmico baseado na volatilidade
- Parâmetros de otimização auto-adaptação: desenvolvimento de mecanismos de otimização de parâmetros dinâmicos, melhorar a adaptabilidade da estratégia
Resumir
A estratégia, combinando os benefícios do MACD e do RSI, constrói um sistema de negociação com características de acompanhamento de tendências e dinâmicas. Um mecanismo de controle de risco perfeito e uma lógica de negociação clara tornam-na de boa prática.
Source
Pine
/*backtest
start: 2019-12-23 08:00:00
end: 2024-12-11 08:00:00
period: 1d
basePeriod: 1d
exchanges: [{"eid":"Futures_Binance","currency":"BTC_USDT"}]
*/

// This source code is subject to the terms of the Mozilla Public License 2.0 at https://mozilla.org/MPL/2.0/
//@version=5
strategy("MACD + RSI Basit Strateji", overlay=true, initial_capital=1000, default_qty_type=strategy.percent_of_equity, default_qty_value=100)
Strategy parameters
Related strategies
Comment
All comments (0)
No data
- 1