Pesquisa sobre a versão otimizada da estratégia de entrada flexível de crossover de cinco dias com base em RSI e MACD

Visão geral
Esta estratégia é uma estratégia de negociação quantitativa que combina um índice relativamente fraco (RSI) e um indicador de tendência/diferença de média móvel (MACD). O núcleo da estratégia é determinar a direção da tendência do mercado através da observação de áreas de sobrevenda/sobrevenda do RSI, em combinação com o indicador MACD em cerca de 5 ciclos de negociação, e definir um stop loss para controlar o risco. Esta abordagem não só pode fornecer um sinal de negociação mais preciso, mas também pode reduzir eficazmente o risco de falsos sinais.
Princípio da estratégia
A estratégia é baseada nos seguintes componentes principais:
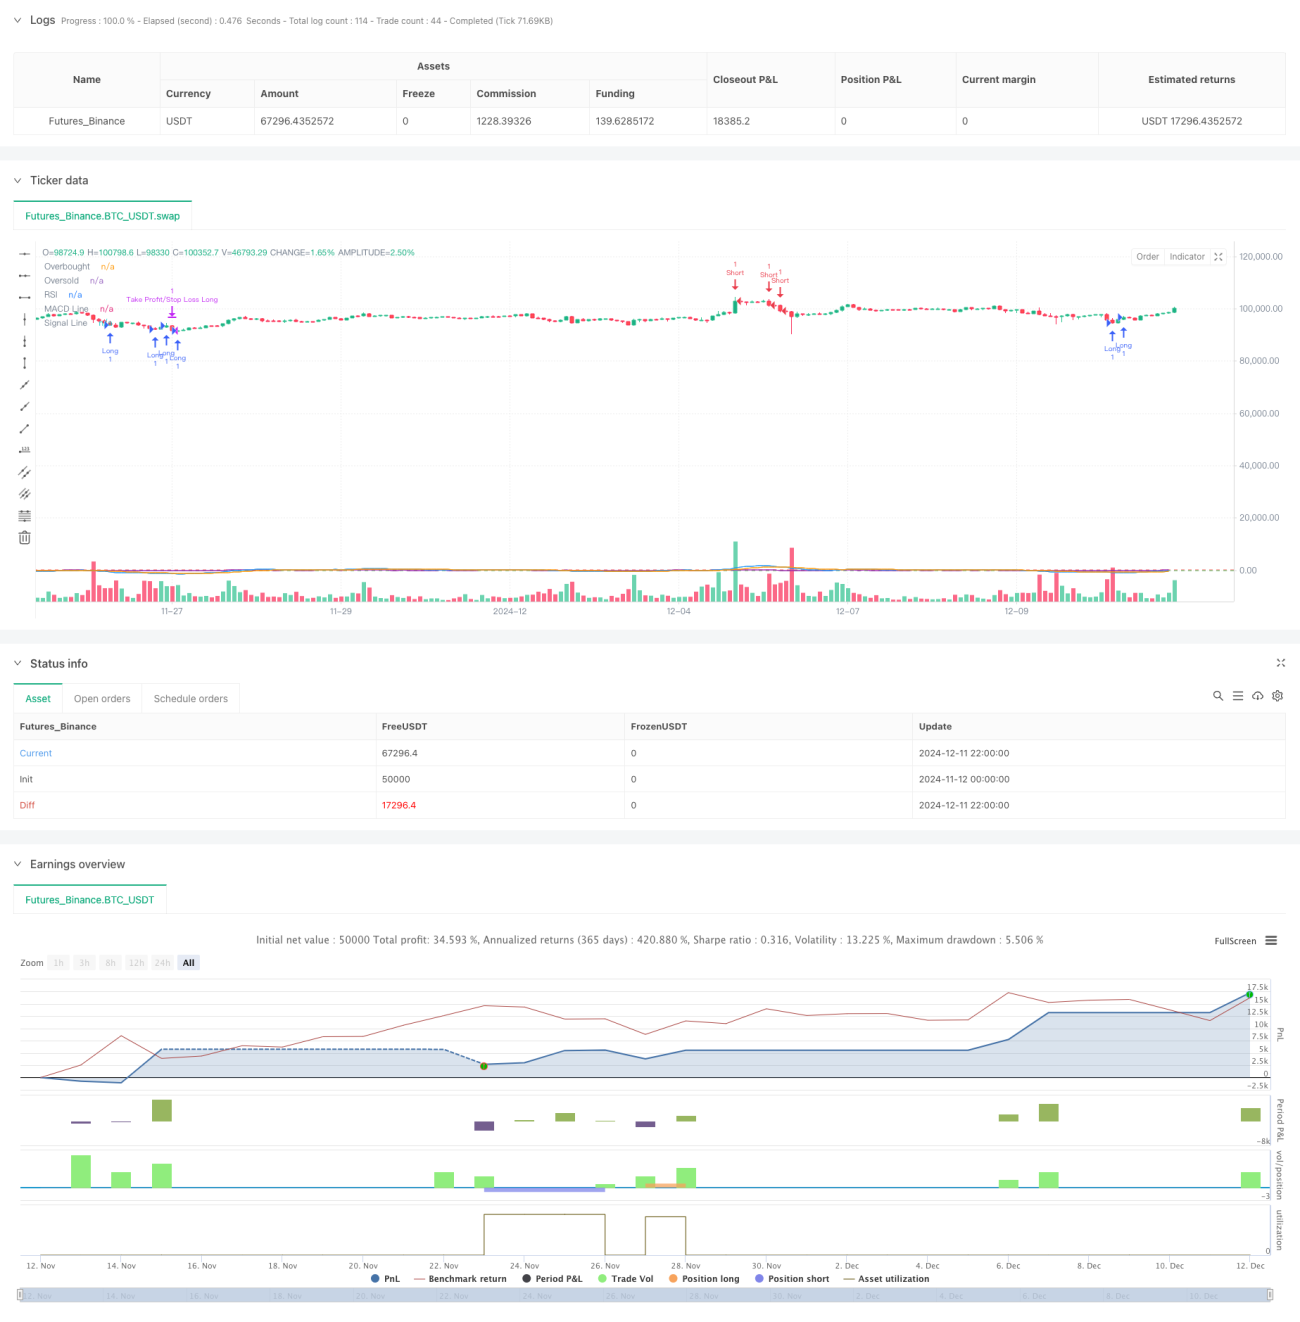
- O indicador RSI usa 14 ciclos como configuração de parâmetros para identificar oportunidades potenciais de reversão, julgando se o ativo está em um estado de sobrecompra (<70) ou sobrevenda (<30).
- O indicador MACD usa a combinação clássica de parâmetros 12-26-9 para confirmar a mudança de tendência, procurando o cruzamento da linha MACD com a linha de sinal em 5 ciclos de negociação.
- A lógica de entrada inclui duas condições:
- Faça mais condições: o RSI tem um mínimo de menos de 30 em cinco períodos, enquanto a linha MACD aparece em quase cinco períodos de cruzamento ascendente com a linha de sinal.
- Condições de vazio: RSI com valores máximos acima de 70 em cinco períodos, enquanto a linha MACD aparece com a linha de sinal de cruzamento para baixo em quase cinco períodos.
- O controle de risco usa uma configuração simétrica de 2% de stop loss e 2% de stop loss.
Vantagens estratégicas
- A verificação cruzada de múltiplos indicadores aumenta a confiabilidade do sinal e, através da combinação de RSI e MACD, é capaz de filtrar efetivamente os falsos sinais que um único indicador pode gerar.
- A janela de observação de cinco dias permite capturar mais oportunidades de negociação, evitando perder pontos de inflexão importantes.
- A configuração de stop loss simétrica é útil para a gestão de fundos e pode controlar o risco de uma única transação.
- A lógica da estratégia é simples, clara, fácil de entender e executar, e é adequada para a otimização adicional da estratégia básica.
Risco estratégico
- O RSI e o MACD são indicadores de atraso e podem ocorrer atrasos em mercados com forte volatilidade.
- A proporção de stop loss fixa pode não ser adequada para todos os cenários de mercado e precisa ser ajustada em tempo hábil em função da variação da taxa de flutuação.
- O ciclo de observação de 5 dias pode ser muito curto em certas condições de mercado, resultando em excesso de negociação.
- Sem levar em conta o volume de transações, pode gerar sinais imprecisos em um ambiente de baixa liquidez.
Direção de otimização da estratégia
- Introdução de um mecanismo de adaptação da taxa de flutuação, ajustando dinamicamente a proporção de stop loss de acordo com a flutuação do mercado.
- Aumentar o índice de volume de transação como confirmação auxiliar, aumentando a confiabilidade do sinal.
- Desenvolvimento de mecanismos de seleção de ciclos dinâmicos que ajustam automaticamente o tamanho da janela de observação de acordo com a situação do mercado.
- Adicionar filtros de tendência para evitar a negociação contracorrente em mercados de forte tendência.
- Considere a introdução de filtros de tempo para evitar a negociação em períodos de maior volatilidade, como abertura e fechamento do mercado.
Resumir
A estratégia, combinando os indicadores RSI e MACD, com condições de entrada flexíveis e mecanismos de controle de risco, constrói um sistema de negociação relativamente completo. Embora existam algumas áreas que precisam de otimização, a estrutura básica tem uma boa escalabilidade e, com mais otimização e aperfeiçoamento, espera-se que se torne uma estratégia de negociação mais robusta.
- 1