
Visão Geral
Esta estratégia utiliza uma combinação de Bandas de Bollinger e o indicador Triplo SuperTrend para realizar operações. Através da análise da faixa de volatilidade das Bandas de Bollinger e da confirmação de tendência do Triplo SuperTrend, forma-se um sistema robusto de acompanhamento de tendência. As Bandas de Bollinger são usadas para identificar movimentos extremos de preço, enquanto o Triplo SuperTrend, com diferentes parâmetros, fornece múltiplas confirmações da direção da tendência. As operações são realizadas apenas quando todos os sinais estão alinhados, reduzindo o risco de sinais falsos. Essa abordagem combinada preserva as vantagens do acompanhamento de tendência e aumenta a confiabilidade das operações.
Princípio da Estratégia
A lógica central da estratégia inclui as seguintes partes principais:
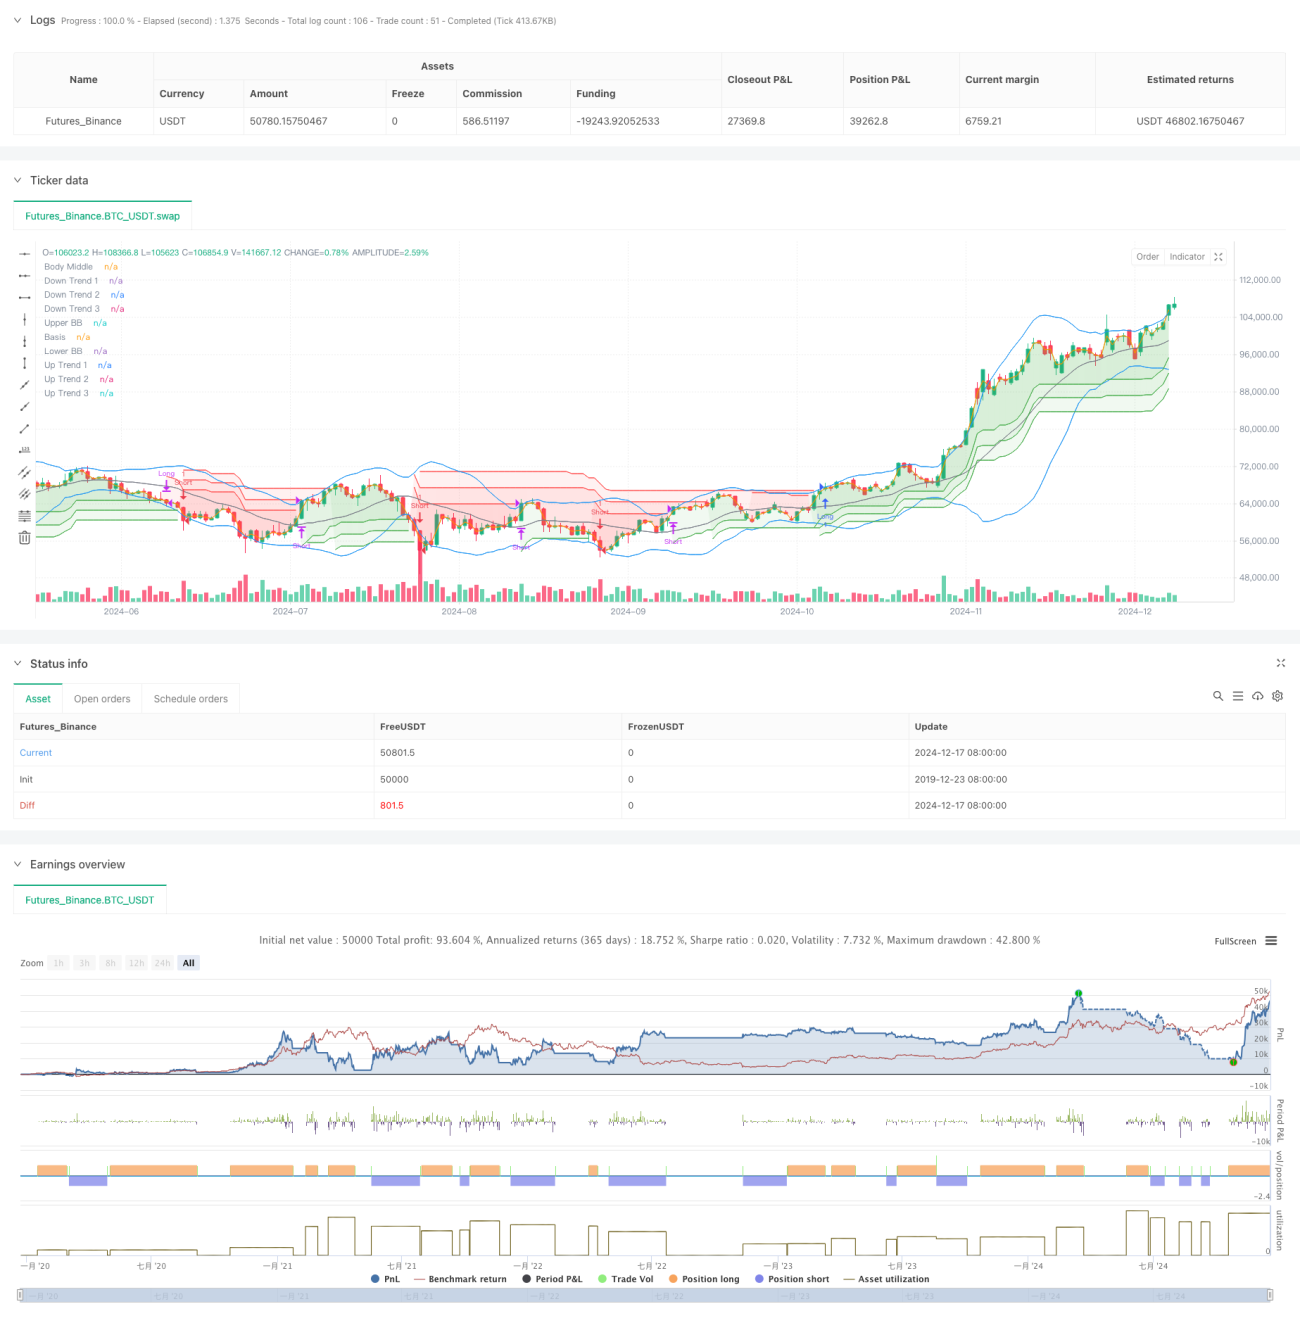
- Utiliza Bandas de Bollinger de 20 períodos com desvio padrão de 2,0 para avaliar a volatilidade dos preços.
- Define três linhas SuperTrend com períodos de 10 e parâmetros de 3,0, 4,0 e 5,0, respectivamente.
- Condição de entrada longa: o preço rompe a banda superior de Bollinger e todas as três linhas SuperTrend indicam tendência de alta.
- Condição de entrada curta: o preço rompe a banda inferior de Bollinger e todas as três linhas SuperTrend indicam tendência de baixa.
- Quando qualquer uma das linhas SuperTrend muda de direção, a posição atual é fechada.
- Utiliza a linha de preço médio como referência de preenchimento para melhorar o efeito visual.
Vantagens da Estratégia
- Mecanismo de múltiplas confirmações: a combinação das Bandas de Bollinger com o Triplo SuperTrend reduz significativamente os sinais falsos.
- Forte capacidade de acompanhamento de tendência: a configuração progressiva dos parâmetros do SuperTrend captura eficazmente tendências em diferentes escalas.
- Controle de risco bem elaborado: fecha rapidamente as posições quando surgem sinais de reversão da tendência, limitando as perdas.
- Alta flexibilidade de parâmetros: todos os parâmetros dos indicadores podem ser otimizados de acordo com as características do mercado.
- Alto nível de automação: a lógica da estratégia é clara, facilitando a implementação sistemática.
Riscos da Estratégia
- Risco em mercado de lateralização: pode gerar sinais falsos frequentes durante períodos de consolidação.
- Impacto do slippage: em momentos de alta volatilidade, pode haver perdas significativas devido ao slippage.
- Risco de atraso: o mecanismo de múltiplas confirmações pode resultar em entradas tardias.
- Sensibilidade aos parâmetros: diferentes combinações de parâmetros podem levar a grandes variações no desempenho da estratégia.
- Dependência do ambiente de mercado: a estratégia tem melhor desempenho em mercados com tendência clara.
Direções de Otimização da Estratégia
- Introduzir indicadores de volume: confirmar a validade dos rompimentos de preço com volume.
- Otimizar mecanismo de stop loss: adicionar stop loss dinâmico ou baseado em ATR.
- Incluir filtro de horário: proibir operações em determinados períodos para evitar movimentos ineficientes.
- Adicionar filtro de volatilidade: ajustar o tamanho da posição ou interromper operações durante períodos de volatilidade excessiva.
- Desenvolver mecanismo adaptativo de parâmetros: ajustar dinamicamente os parâmetros conforme as condições do mercado.
Resumo
Esta é uma estratégia de acompanhamento de tendência que combina Bandas de Bollinger com o Triplo SuperTrend, aumentando a confiabilidade das operações por meio da confirmação de múltiplos indicadores técnicos. A estratégia possui forte capacidade de captura de tendências e controle de risco, mas é importante considerar a influência do ambiente de mercado no desempenho. Com otimizações e ajustes contínuos, a estratégia tem potencial para manter um desempenho estável em diferentes condições de mercado. Recomenda-se realizar backtests completos e otimização de parâmetros antes da negociação ao vivo, além de fazer ajustes adequados com base nas condições reais do mercado.
//@version=5
strategy("Demo GPT - Bollinger + Triple Supertrend Combo", overlay=true, commission_type=strategy.commission.percent, commission_value=0.1, slippage=3)

// -------------------------------
// User Input for Date Range
// -------------------------------
startDate = input(title="Start Date", defval=timestamp("2018-01-01 00:00:00"))
endDate   = input(title="End Date",   defval=timestamp("2069-12-31 23:59:59"))

// -------------------------------
// Bollinger Band Inputs
// -------------------------------- 1