
Visão geral
A estratégia é uma estratégia de negociação de opções de acompanhamento de tendências baseada em uma combinação de vários indicadores técnicos. Usando principalmente o cruzamento EMA como sinal central, em combinação com a direção da tendência confirmada pelo SMA, VWAP, e filtrando o sinal usando o MACD e o RSI como indicadores auxiliares.
Princípio da estratégia
A estratégia usa o cruzamento dos EMAs de 8 e 21 ciclos como sinal principal de negociação, e a multi-sinal é acionada quando a curta EMA atravessa a EMA de longo prazo e as seguintes condições são satisfeitas: o preço está acima dos 100 e 200 ciclos SMA, a linha MACD está acima da linha de sinal, e o RSI é maior que 50. Os termos de ação do sinal de curto são os opostos. A estratégia introduz o VWAP como referência de peso de preço para ajudar a determinar a posição relativa do preço atual.
Vantagens estratégicas
- Multi-indicadores de colaboração para aumentar a confiabilidade do sinal através de diferentes períodos e tipos de indicadores de verificação cruzada
- Usar a combinação de rastreamento de tendências e indicadores de dinâmica para capturar tendências e focar na dinâmica de curto prazo
- A fixação de um ponto de parada ajuda a proteger os lucros e a evitar a ganância excessiva.
- Gestão rigorosa das posições, evitando a reabertura de posições e reduzindo a exposição ao risco
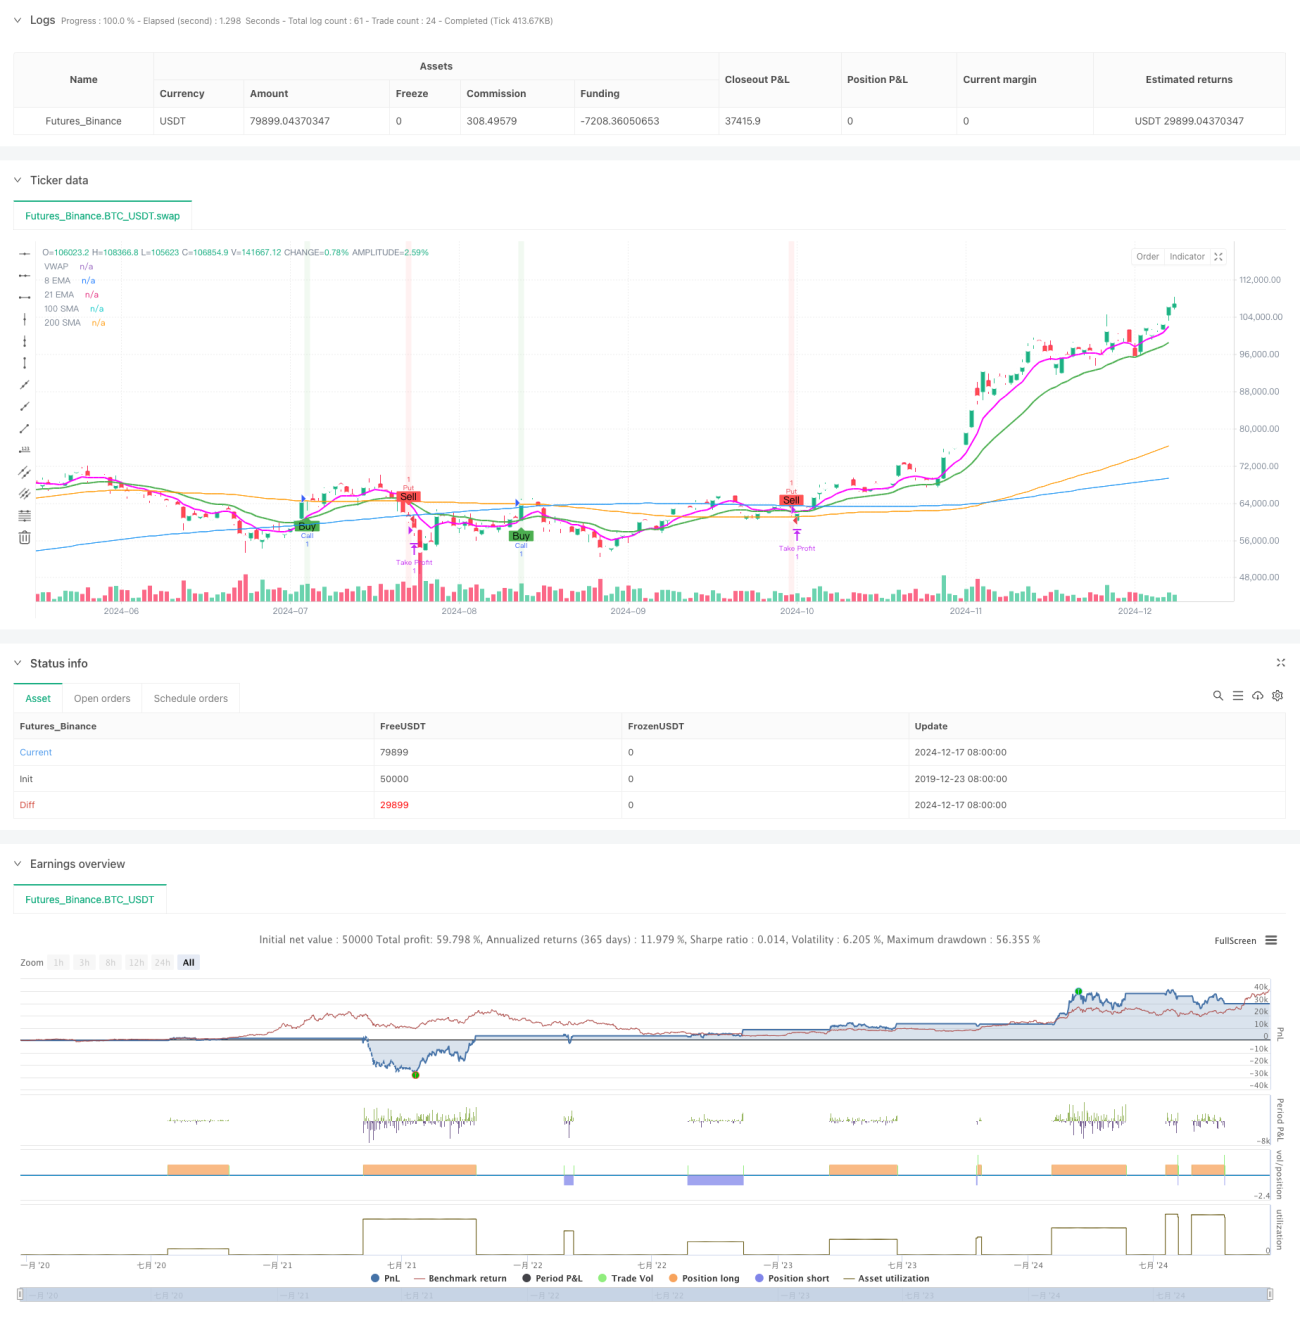
- Visualizações claras, com movimentos EMA, SMA, VWAP e sinalização
Risco estratégico
- Sinais falsos frequentes podem ocorrer em mercados voláteis
- A fixação de um ponto de parada pode levar a perder oportunidades de lucro maiores
- Sem paradas, pode sofrer grandes perdas em situações extremas
- O uso de vários indicadores pode causar atraso no sinal
- Risco de deslizamento em contratos de opções com pouca liquidez
Direção de otimização da estratégia
- Introdução de um mecanismo de stop-loss adaptável, ajustado à dinâmica de volatilidade do mercado
- Adição de módulo de gerenciamento de volume de transação, ajustando posições dinamicamente de acordo com o tamanho da conta e as condições do mercado
- Adição de filtros de volatilidade de mercado para ajustar os parâmetros de estratégia em um ambiente de alta volatilidade
- Parâmetros de indicadores de otimização, pode considerar o uso de ciclos adaptativos em vez de ciclos fixos
- Aumentar o filtro de tempo para evitar a negociação em períodos de maior volatilidade, como abertura e fechamento do mercado
Resumir
Esta é uma estratégia de negociação de opções multi-indicadores de tendências de rastreamento de opções, com uma estrutura completa e lógica clara. A estratégia aumenta a confiabilidade do sinal de negociação através da combinação de vários indicadores técnicos e usa pontos de parada fixos para gerenciar o risco.
/*backtest
start: 2019-12-23 08:00:00
end: 2024-12-18 08:00:00
period: 1d
basePeriod: 1d
exchanges: [{"eid":"Futures_Binance","currency":"BTC_USDT"}]
*/

//@version=5
strategy("OptionsMillionaire Strategy with Take Profit Only", overlay=true, default_qty_type=strategy.fixed, default_qty_value=1)

// Define custom magenta color- 1